
OCR Specification focus:
‘Use graphical methods to add wave displacements and predict outcomes.’
Graphical superposition methods allow physicists to visualise how waves combine at a point in space and time. By adding displacements graphically, the resultant wave form can be predicted with precision.
Understanding Superposition
The Principle of Superposition
When two or more waves overlap, the total displacement at any point is the vector sum of their individual displacements. This principle applies to all types of waves, including sound, light, and water waves.
Superposition: When two or more waves overlap, the resultant displacement equals the sum of individual displacements at that point.
This fundamental idea underpins interference, diffraction, and the formation of stationary waves. Graphical methods provide a practical way to represent and predict the results of wave interactions.
Representing Waves Graphically
Graphical Wave Representation
A wave can be represented on a displacement–distance or displacement–time graph. These show how displacement varies across space or time, respectively. Each point on the graph represents a particular position or instant for a particle in the medium.
When using graphical superposition:
Both waves must be drawn on the same axes.
Each wave’s displacement must be taken at corresponding points or times.
The total displacement is found by adding or subtracting displacements at each point.
This approach works for any pair of waves of the same type, provided they exist in the same region simultaneously.
The Process of Graphical Superposition
Step-by-Step Method
To apply graphical superposition, follow these steps carefully:
Draw both waves on the same set of axes, ensuring their displacements are plotted on the same scale.
Choose a series of positions or times where displacements will be measured.
At each point, add (for in-phase displacements) or subtract (for opposite displacements) the amplitudes of the individual waves.
Plot the resultant displacement at each point to form the combined wave.
Connect the resultant points smoothly to reveal the overall wave pattern.
The accuracy of this process depends on consistent scaling and careful attention to phase relationships.
Understanding Phase and Its Role
Phase and Phase Difference
Phase describes the position of a point within one complete cycle of a wave. It is usually measured in degrees or radians.
Phase Difference: The fraction of a cycle by which one wave leads or lags another, measured in degrees (°) or radians (rad).
If two waves are in phase, their peaks and troughs align, leading to maximum constructive interference. If they are out of phase by 180° (π radians), one wave’s peak aligns with the other’s trough, producing destructive interference.
Graphical methods make these relationships visually clear by showing how the waves overlap point by point.
Constructive and Destructive Addition
Visualising Interference Effects
Using graphical methods, two key interference outcomes can be identified:
Constructive interference occurs when displacements are in the same direction, producing a larger resultant amplitude.
Destructive interference occurs when displacements oppose each other, leading to reduction or cancellation.
At points between these extremes, the resultant amplitude lies somewhere between maximum and minimum, depending on the degree of phase difference.
Resultant Wave: The wave pattern formed when two or more waves overlap, determined by the vector sum of their displacements.
Each resultant point on the graph shows the physical displacement of the medium where the waves meet.
Graphical Superposition in Practice
Equal Frequency and Amplitude Waves
When two waves of equal frequency and amplitude combine:
If in phase, their amplitudes add, and the resultant amplitude is twice the original.
If out of phase by 180°, they cancel completely, giving zero resultant displacement.
Graphically, this is seen as perfect reinforcement or complete flattening of the waveform, respectively. Intermediate phase differences yield intermediate resultant amplitudes.
Different Frequencies or Amplitudes
When two waves differ in frequency or amplitude, graphical addition produces complex resultant patterns. These may vary in time, showing beats or modulations in amplitude.
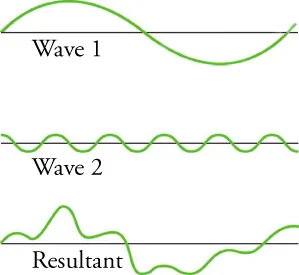
Two waves of different amplitude and frequency combine to form a non-sinusoidal resultant obtained by adding displacements point-by-point. This reinforces that superposition applies generally, not only to identical waves. Any extra references to standing waves or other phenomena on the page are beyond this subsubtopic and can be ignored. Source.
EQUATION
—-----------------------------------------------------------------
Beat Frequency (fᵦ) = |f₁ − f₂|
f₁, f₂ = Frequencies of the two combining waves (Hz)
—-----------------------------------------------------------------
Graphically, beats appear as a varying envelope amplitude, highlighting the periodic increase and decrease in intensity.
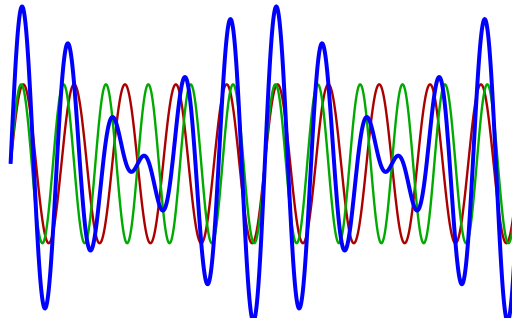
Two equal-amplitude waves with slightly different frequencies (red and green) superpose to produce a blue resultant whose amplitude rises and falls—the beat envelope. This directly illustrates the graphical signature of beats mentioned in the notes. The specific 5:6 frequency ratio shown is illustrative and not required by the syllabus. Source.
Vector Nature of Displacement
Considering Vector Addition
Because wave displacement has direction as well as magnitude, graphical superposition is effectively vector addition. For transverse waves, upward displacements are positive, downward are negative.
For longitudinal waves, forward compressions are treated as positive and rarefactions as negative. This ensures correct addition of displacements and accurate resultant waveforms.
Application to Multiple Waves
Extending the Method
While graphical superposition is often demonstrated for two waves, it can be extended to multiple overlapping waves. Each additional wave’s displacement is added sequentially at every point. The resulting waveform can become complex but follows the same principles:
Displacements are added algebraically at each location or time.
The resultant waveform reveals the combined effect of all contributors.
Regular patterns may form if waves are coherent; irregular patterns result if they are not.
Coherence: Two or more waves that maintain a constant phase difference and the same frequency.
Graphical addition of coherent waves produces stable interference patterns, while incoherent waves yield fluctuating or averaged results.
Predicting Physical Outcomes
Using Graphs to Anticipate Behaviour
By using displacement–time or displacement–distance graphs, students can predict:
Points of maximum and minimum displacement (antinodes and nodes in stationary contexts).
Regions of constructive or destructive interference.
Overall amplitude variations due to phase or frequency changes.
This makes graphical methods essential for visualising how real-world interference patterns arise in experiments involving light, sound, or microwaves.
Limitations of the Graphical Method
While the method is intuitive, it has some constraints:
It becomes less precise when dealing with more than two or three waves.
It assumes perfect coherence and neglects energy losses.
It is mainly qualitative unless supported by mathematical analysis.
Nevertheless, it provides a powerful conceptual tool for visualising how waveforms interact, aligning perfectly with the OCR requirement to “use graphical methods to add wave displacements and predict outcomes.”
Practice Questions
Question 1 (2 marks)
Two identical waves overlap in phase. Each wave has an amplitude of 3.0 cm.
(a) State the amplitude of the resultant wave.
(b) Explain your answer.
Mark scheme:
(a) Resultant amplitude = 6.0 cm (1 mark)
(b) Waves are in phase, so their displacements add to produce constructive interference (1 mark)
Question 2 (5 marks)
Two progressive waves of the same frequency and amplitude travel through the same medium in the same direction. The phase difference between them is 120°.
(a) Using a graphical superposition method, describe how you would determine the resultant wave’s amplitude and shape at a particular instant.
(b) Explain qualitatively how the resultant amplitude varies as the phase difference changes between 0° and 180°.
(c) State the condition for complete destructive interference.
Mark scheme:
(a)
Draw both waves on the same displacement axis (1 mark)
Measure and add the displacements of both waves point-by-point at corresponding positions (1 mark)
Plot the resultant displacement values to form the resultant waveform (1 mark)
(b)
As phase difference increases from 0° to 180°, the resultant amplitude decreases from maximum (constructive) to minimum (destructive) (1 mark)
At 180° phase difference, the two waves cancel completely (1 mark)
(c)
Complete destructive interference occurs when waves have equal amplitude and a phase difference of 180° (1 mark)
FAQ
Algebraic superposition involves adding displacements mathematically using equations or trigonometric relationships, suitable when the waves are represented analytically.
Graphical superposition, by contrast, is a visual method. The displacements of overlapping waves are added point-by-point using displacement–distance or displacement–time graphs.
Graphical techniques are particularly useful for complex or irregular waveforms where algebraic addition is difficult, and they help visualise constructive and destructive interference clearly.
In experimental settings, real waves often have varying amplitudes, frequencies, or phase shifts that are hard to express numerically.
The graphical method lets experimenters:
Sketch measured waveforms directly from oscilloscope traces.
Observe interference visually without complex calculations.
Identify regions of constructive and destructive interference quickly.
This makes it ideal for interpreting results in two-source interference or beat-frequency experiments.
Phase difference determines how the peaks and troughs of two waves align.
0° phase difference: waves add perfectly, doubling amplitude.
180° phase difference: waves oppose each other completely, producing cancellation.
Intermediate phase difference: results in partial reinforcement or reduction.
Graphically, the wave becomes progressively distorted as phase difference increases, showing smaller or shifted peaks depending on how the cycles overlap.
Yes. Coherent waves maintain a constant phase difference and frequency, so their graphical addition produces stable, repeatable interference patterns.
Incoherent waves, such as light from two independent lamps, have random phase differences that change rapidly over time. When added graphically, their result appears as a fluctuating, irregular line—averaging out to no clear interference pattern.
This highlights why coherence is essential for observing predictable interference effects.
Common errors include:
Incorrect scaling: mismatched amplitude or axis scales distort the resultant wave.
Phase misalignment: forgetting to align points of equal phase before adding displacements.
Inconsistent spacing: uneven intervals along the x-axis lead to inaccurate wave shapes.
To reduce errors, use graph paper, plot consistent intervals, and ensure the same reference point and scale are maintained for both waves before combining their displacements.

.svg)