
OCR Specification focus:
‘Use LEDs and eV = hc/λ to estimate Planck’s constant; no semiconductor theory required.’
Light-emitting diodes (LEDs) provide an accessible and accurate way to estimate Planck’s constant (h) by linking photon energy to the wavelength of emitted light. This practical experiment reinforces the quantum nature of light and bridges the gap between classical and quantum physics.
The Principle of the Method
The experiment relies on the photon model of electromagnetic radiation, where each photon has an energy proportional to its frequency. When a current flows through an LED, electrons recombine with holes, emitting photons. The threshold voltage at which light just begins to glow indicates the minimum energy needed to produce photons of a particular wavelength.
At this threshold, the electrical energy per electron equals the photon energy, which forms the basis of the experiment to estimate Planck’s constant.
Relationship Between Voltage and Photon Energy
The experiment links measurable quantities—voltage and wavelength—to determine Planck’s constant.
EQUATION
—-----------------------------------------------------------------
Photon Energy (E) = hf = hc/λ
E = Energy of a single photon (joules, J)
h = Planck’s constant (6.63 × 10⁻³⁴ J·s)
f = Frequency of light (hertz, Hz)
c = Speed of light in vacuum (3.00 × 10⁸ m·s⁻¹)
λ = Wavelength of emitted light (metres, m)
—-----------------------------------------------------------------
At the LED’s threshold, the energy gained by an electron passing through a potential difference V is given by eV, where e is the elementary charge (1.60 × 10⁻¹⁹ C). The emitted photon energy equals this electrical energy:
EQUATION
—-----------------------------------------------------------------
Energy Relationship: eV = hc/λ
e = Elementary charge (1.60 × 10⁻¹⁹ C)
V = Threshold voltage (volts, V)
h = Planck’s constant (J·s)
c = Speed of light (m·s⁻¹)
λ = Wavelength (m)
—-----------------------------------------------------------------
Thus, rearranging gives an experimental expression for Planck’s constant:
EQUATION
—-----------------------------------------------------------------
Planck’s Constant (h) = eλV / c
—-----------------------------------------------------------------
This forms the working equation for estimating h using LEDs.
Experimental Setup and Equipment
Apparatus
Several LEDs of different known wavelengths (e.g. red, green, blue)
Variable DC power supply (0–5 V range)
Resistor (to limit current and protect LEDs)
Connecting wires and breadboard
Digital voltmeter and ammeter
Darkened environment for better visibility of threshold light emission
Circuit Arrangement
The LED is connected in series with a protective resistor and a variable power supply. The voltmeter is placed across the LED to measure its potential difference, and the ammeter is inserted in series to record current flow.
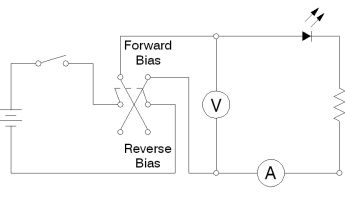
Schematic of an LED with a series resistor and selectable measurement of voltage and current. The layout illustrates forward bias and where to place meters without altering the circuit behaviour. Any additional switching shown is purely for demonstration and is not required for the basic threshold-voltage method. Source.
Experimental Procedure
Assemble the circuit ensuring correct LED polarity (anode to positive terminal, cathode to negative).
Increase the supply voltage slowly from zero until the LED just begins to emit visible light.
Record the threshold voltage (V) at which emission occurs.
Repeat for several LEDs of different known wavelengths (λ).
Plot a graph of V against 1/λ (reciprocal of wavelength).
From the equation eV = hc/λ, this graph should produce a straight line with a gradient equal to hc/e.
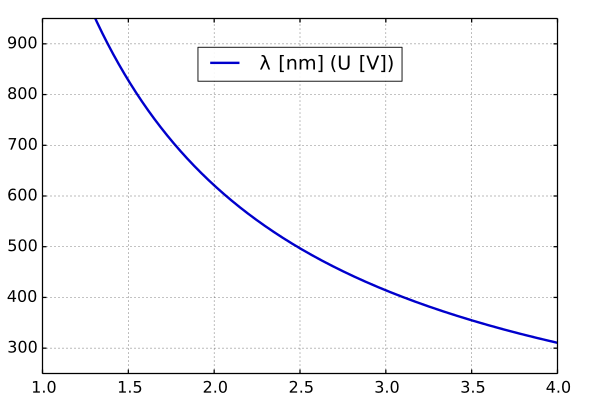
Calculated curve showing wavelength vs. LED bias voltage in the 1–4 V range, consistent with λ = hc/(eV). As voltage increases, the predicted wavelength decreases, aligning with the method’s core relation. This plot is schematic—not raw data—and serves as a conceptual reference for the experiment. Source.
Using the gradient (m), Planck’s constant can be found from:
EQUATION
—-----------------------------------------------------------------
h = (e × m) / c
—-----------------------------------------------------------------
This provides an experimental value of h using only basic electrical and optical measurements.
Understanding the Underlying Quantum Process
When current flows through an LED, electrons in the conduction band recombine with holes in the valence band, releasing energy as photons. The photon’s energy corresponds to the energy gap between these bands, which depends on the material’s composition and colour of emitted light.
At the threshold voltage, the energy supplied is just sufficient to produce photons of energy hf. Any higher voltage increases brightness but not photon energy, as additional energy contributes to higher emission rates rather than increased frequency.
Avoiding the Need for Semiconductor Theory
Although the LED operation involves semiconductors, understanding their detailed band theory is not required. Students only need to recognise that:
The threshold voltage corresponds to the minimum energy required for photon emission.
Each colour LED emits photons of specific wavelength, determined by the material’s energy band gap.
The experiment works because photon energy and wavelength are quantitatively related through the Planck–Einstein relation (E = hf).
This simplified approach keeps the focus on quantum principles, aligning with OCR expectations.
Sources of Error and Good Practice
Key Uncertainties
Human error in judging the threshold voltage visually when the LED first glows.
Voltage measurement inaccuracies due to limited resolution of digital meters.
Wavelength inaccuracies if LED wavelengths are taken from manufacturer data rather than measured directly.
Methods to Improve Accuracy
Conduct the experiment in a darkened room to identify the precise threshold more clearly.
Use a light sensor or photodiode to detect the first measurable light intensity instead of relying on the human eye.
Use high-quality laboratory power supplies and digital meters with fine resolution.
Record multiple readings for each LED and calculate an average threshold voltage to minimise random error.
Interpreting and Evaluating Results
A linear relationship between V and 1/λ confirms the theoretical prediction of photon energy proportional to frequency. The experimentally derived Planck’s constant should be close to the accepted value, typically within 10% accuracy, depending on apparatus precision and visual judgement.
This practical investigation not only reinforces the quantum energy concept but also illustrates how macroscopic measurements (voltage and wavelength) can reveal fundamental microscopic constants governing all electromagnetic radiation.
Practice Questions
Question 1 (2 marks)
A student uses a red LED to estimate Planck’s constant. The LED begins to emit light at a potential difference of 1.8 V. The wavelength of the emitted light is 690 nm.
Explain how this measurement can be used to estimate Planck’s constant.
Mark scheme:
(1 mark) Recognises that at threshold, the energy gained by each electron is equal to the photon energy, i.e. eV = hc/λ.
(1 mark) Rearranges to h = eλV / c and states that substituting known values gives an estimate for Planck’s constant.
Question 2 (5 marks)
Describe an experiment using LEDs of different colours to determine an experimental value for Planck’s constant. Include in your answer:
how the measurements are obtained,
the relationship used to calculate Planck’s constant, and
how accuracy can be improved.
Mark scheme:
(1 mark) Describes setting up a circuit with an LED, resistor, power supply, voltmeter across the LED, and ammeter in series.
(1 mark) States that the threshold voltage is the voltage at which the LED just begins to emit visible light.
(1 mark) Mentions repeating with LEDs of different known wavelengths (λ) and recording the corresponding threshold voltages (V).
(1 mark) States that plotting V against 1/λ gives a straight line with gradient equal to hc/e, from which h can be calculated.
(1 mark) Explains at least one method to improve accuracy, e.g. performing the experiment in a dark room, using a light sensor instead of the eye, or taking multiple readings to average results.
FAQ
The onset of visible light emission is gradual rather than sudden, making it subjective to identify the exact point when the LED first glows. Human eyesight sensitivity varies between individuals and colours, adding uncertainty.
A small background current can flow before visible emission, slightly altering the apparent threshold voltage. Using a light sensor or photodiode instead of the eye can help identify the true onset of photon emission more precisely.
Visible LEDs allow direct observation of when light is emitted, which is necessary to identify the threshold voltage.
Infrared or ultraviolet LEDs emit radiation outside the visible spectrum, requiring photodetectors and specialised equipment to detect emission. This increases complexity without improving accuracy.
Using visible LEDs of different colours ensures wavelengths are well known, easily measurable, and within safe operating voltages for classroom experiments.
The wavelength of emitted light depends on the energy band gap of the semiconductor material. When an electron recombines with a hole, it releases energy equal to this gap as a photon.
A larger band gap corresponds to higher photon energy and therefore shorter wavelength (e.g. blue LEDs).
A smaller band gap produces lower energy photons with longer wavelength (e.g. red LEDs).
Manufacturers select semiconductor compounds such as GaAs, GaP, or GaN to achieve specific emission colours.
Several sources of error can lead to discrepancies:
Threshold voltage uncertainty due to visual detection or voltage resolution.
LED wavelength variation from manufacturer averages, not exact peak emission.
Contact potential differences and internal resistance within the LED altering the measured voltage.
Minimising systematic errors through careful calibration and repeated measurements improves consistency with the accepted value.
Yes, but LEDs offer simplicity and direct relation between applied voltage and photon energy.
Using gas discharge tubes or photoemissive devices can also link photon energy to potential difference, but these require higher voltages and more complex analysis.
LEDs provide a controlled, low-voltage, and safe way to test the quantum relationship between photon energy and wavelength, making them ideal for laboratory estimation of Planck’s constant.
