
OCR Specification focus:
‘Determine h using different coloured LEDs and threshold voltages in a circuit.’
Estimating Planck’s constant using light-emitting diodes (LEDs) is a practical experiment that demonstrates the quantised nature of light and the link between electrical energy and photon emission.
Understanding the Principle
The LED method provides a hands-on way to measure Planck’s constant (h) by relating the energy of emitted photons to the threshold voltage required for light emission. Each LED emits light of a specific wavelength (λ) when electrons recombine with holes in the semiconductor material. By measuring this threshold voltage (V), one can calculate the photon energy and hence estimate h.
This method connects the photon energy equation to electrical energy transfer, reinforcing the concept that energy in quantum processes is discrete, not continuous.
Theoretical Background
When a voltage is applied across an LED, electrons gain energy and can cross the p–n junction, releasing a photon when they recombine with holes.
Threshold voltage (Vₜ): The minimum voltage at which an LED just begins to emit light, corresponding to the photon energy of the emitted radiation.
At this threshold, nearly all supplied electrical energy per electron is converted into photon energy.
EQUATION
—-----------------------------------------------------------------
Photon Energy (E) = eVₜ
E = Energy of a photon (joules, J)
e = Elementary charge (1.60 × 10⁻¹⁹ C)
Vₜ = Threshold voltage (volts, V)
—-----------------------------------------------------------------
Since the energy of a photon is also expressed in terms of its frequency (f) or wavelength (λ):
EQUATION
—-----------------------------------------------------------------
Photon Energy (E) = hf = hc/λ
h = Planck’s constant (J·s)
f = Frequency of emitted light (Hz)
c = Speed of light in vacuum (3.00 × 10⁸ m/s)
λ = Wavelength of emitted light (m)
—-----------------------------------------------------------------
By equating these expressions (eVₜ = hc/λ), one can calculate Planck’s constant.
Experimental Method Overview
The practical LED method for determining Planck’s constant uses several LEDs of different colours, each with a known approximate wavelength. The method relies on careful electrical measurement and accurate wavelength data.
Equipment Required
A selection of LEDs of different colours (e.g., red, green, blue, yellow).
Power supply with fine voltage control.
Resistor (e.g., 330 Ω) to limit current.
Ammeter and voltmeter (digital preferred).
Ruler and diffraction grating or manufacturer data for wavelength determination.
Circuit Setup
The circuit is typically a simple series connection of an LED, resistor, and power supply:

Simple series circuit for an LED with a current-limiting resistor and DC source. This layout underpins the threshold-voltage measurement used to estimate Planck’s constant. The diagram is intentionally minimal, matching the syllabus focus on circuit arrangement rather than semiconductor detail. Source.
Connect the positive terminal of the supply to the anode of the LED.
Insert a resistor in series to limit current.
Place voltmeters across the LED and ammeters in series to monitor values.
Gradually increase voltage until the LED just begins to emit light visibly.
This point of initial light emission corresponds to the threshold voltage (Vₜ).
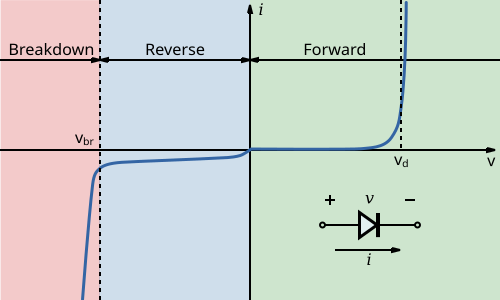
Current–voltage curve of a diode showing reverse region, breakdown, and the forward “on” knee. The forward knee corresponds to the threshold at which an LED begins to conduct and emit light, the condition used to read Vₜ. The reverse-bias and breakdown regions appear for completeness and are not required by the OCR subsubtopic. Source.
Step-by-Step Procedure
Assemble the circuit with one LED and current-limiting resistor.
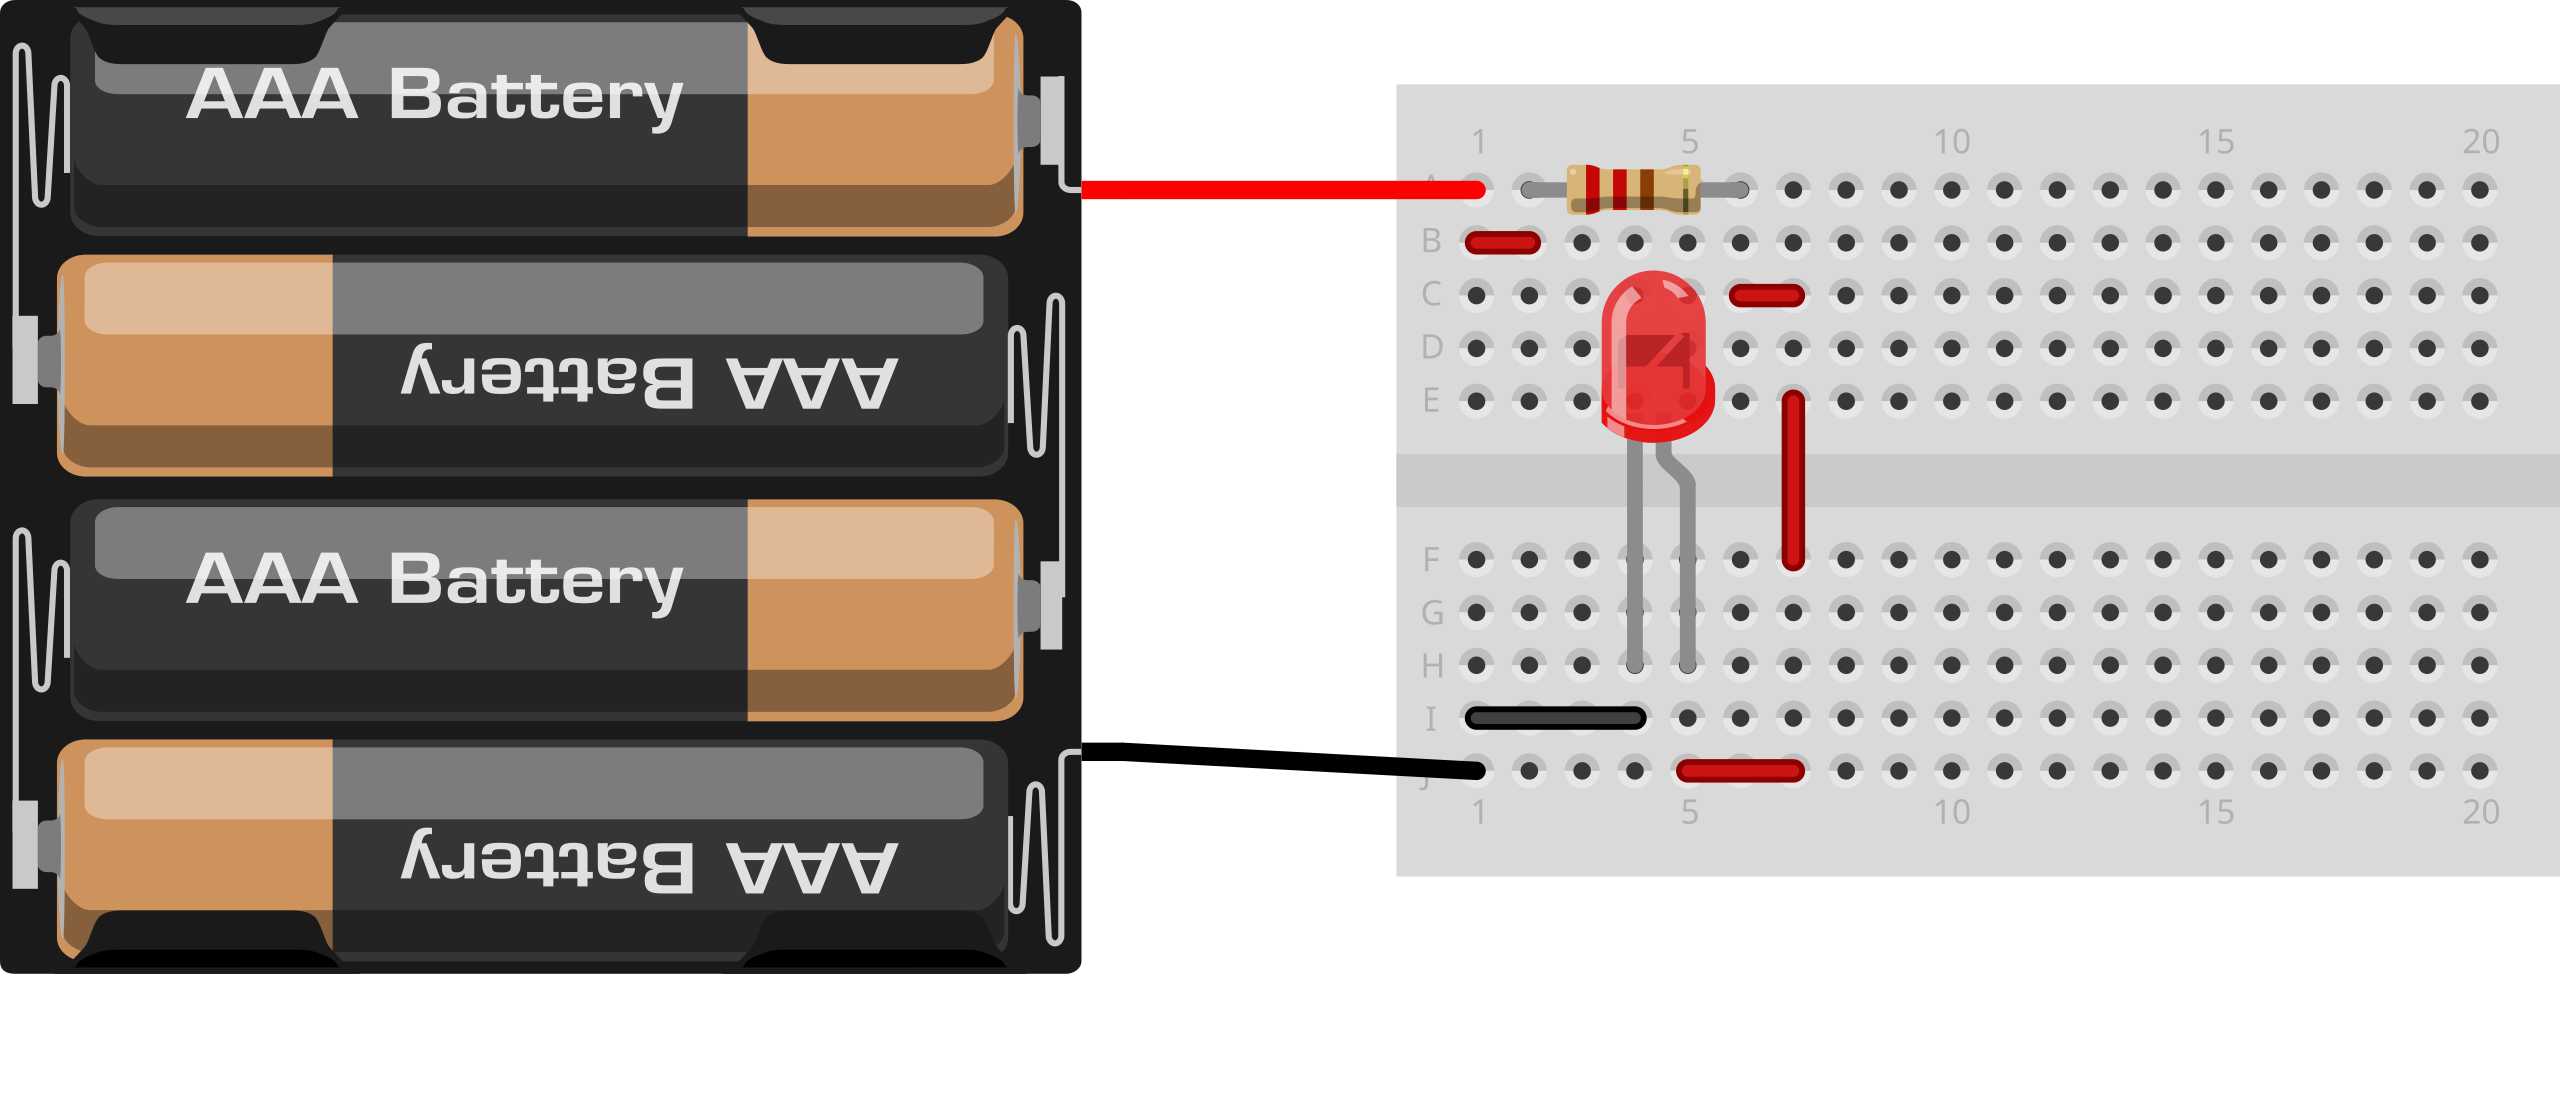
Breadboard layout for a single LED and series resistor. This practical view helps students wire the circuit used to locate the threshold voltage where emission first becomes visible. Extra breadboard rails are shown for clarity; they are standard and not additional components. Source.
Increase the voltage slowly until light is just visible.
Record the threshold voltage (Vₜ) at this point.
Repeat for LEDs of different colours.
Note the wavelength (λ) of each LED from manufacturer data or measurement.
Plot a graph of Vₜ (y-axis) against 1/λ (x-axis).
Data Analysis and Determination of h
The relationship between threshold voltage and wavelength is linear because:
EQUATION
—-----------------------------------------------------------------
eVₜ = hc/λ
—-----------------------------------------------------------------
Rearranging gives:
Vₜ = (hc/e)(1/λ)
Thus, when Vₜ is plotted against 1/λ:
The gradient of the line = hc/e.
Hence, h = (gradient × e) / c.
The experiment therefore provides a direct way to estimate Planck’s constant, linking electrical and optical measurements.
Key Considerations and Sources of Uncertainty
Identifying the Threshold
Determining the exact point of light emission is subjective; the LED begins to glow gradually.
Performing the experiment in a dark room helps to identify this more accurately.
Instrumental Accuracy
Digital voltmeters with fine resolution (e.g., ±0.01 V) improve precision.
Consistent observation conditions reduce error when comparing LEDs.
LED Characteristics
The wavelength may vary slightly from manufacturer specifications.
Temperature can influence the LED’s voltage–current characteristics.
Data Presentation
A straight-line graph with several data points ensures reliable extrapolation.
Anomalous points should be reviewed for experimental or measurement errors.
Conceptual Understanding
This practical reinforces key quantum principles:
Light is emitted in quantised energy packets (photons).
The energy of photons depends directly on their frequency or inversely on their wavelength.
Electrical potential energy converts directly into photon energy, illustrating energy quantisation.
Photon: A discrete packet of electromagnetic energy with energy proportional to its frequency (E = hf).
The experiment provides tangible evidence for the quantum model of light, where energy transfer occurs in discrete units rather than a continuous flow.
Applications and Significance
The LED method exemplifies how modern devices embody quantum phenomena in everyday technology:
LEDs, laser diodes, and solar cells all rely on electron–hole recombination processes.
The measurement of h supports understanding of semiconductor physics and photon emission.
This experiment bridges the gap between classical electrical energy concepts and quantum energy levels.
By experimentally determining Planck’s constant, students connect theoretical quantum ideas with practical observation — a hallmark of modern physics education.
Practice Questions
Question 1 (2 marks)
An LED just begins to emit visible light when a voltage of 1.9 V is applied across it. The LED emits light of wavelength 650 nm.
Using appropriate physical principles, explain what this threshold voltage represents.
Mark Scheme:
1 mark: States that the threshold voltage represents the minimum potential difference needed for electrons to have enough energy to emit photons.
1 mark: Links this to photon energy (eV = hc/λ) or mentions that it corresponds to the energy of photons emitted by the LED.
Question 2 (5 marks)
A student uses several LEDs of different colours to estimate Planck’s constant. The wavelengths of the LEDs are known, and the threshold voltages for each are measured.
(a) Describe how the student should process the data to determine a value for Planck’s constant.
(b) Explain one possible source of uncertainty in this experiment and how it could be reduced.
Mark Scheme:
(a)
1 mark: States that the student should plot a graph of threshold voltage (V) against 1/λ.
1 mark: Recognises that the graph should be a straight line.
1 mark: States that the gradient = hc/e.
1 mark: Explains that h = (gradient × e) / c.
(b)
1 mark: Identifies a valid uncertainty, e.g., difficulty in judging when the LED just begins to emit light.
1 mark: Suggests a reasonable method to reduce it, e.g., conducting the experiment in a darkened room or using a light sensor to detect emission precisely.
FAQ
LEDs have a well-defined emission wavelength and a clear threshold voltage, which makes it easier to relate electrical energy to photon energy.
They also operate safely at low voltages and produce light without requiring heating, unlike filament bulbs.
Additionally, different coloured LEDs cover a useful range of wavelengths across the visible spectrum, enabling a reliable graph of V against 1/λ for determining Planck’s constant.
At the threshold, the emitted light can be very dim and difficult to detect by eye.
To improve accuracy:
Use a light sensor or photodiode to detect the onset of emission quantitatively.
Perform the experiment in a darkened environment to make faint light visible.
Repeat measurements and take an average threshold value for each LED.
Different colours correspond to different wavelengths, providing a range of data points when plotting V against 1/λ.
A larger spread of wavelengths allows a more accurate determination of the gradient and therefore Planck’s constant.
It also helps identify any anomalies or non-linearities, which could arise from variations in LED material or manufacturing.
The main assumption is that the electrical energy (eV) of each electron is converted entirely into photon energy (hf) at the threshold.
This neglects small energy losses such as:
Thermal energy in the LED junction.
Non-radiative recombination where electrons release energy as heat.
These assumptions are valid near the threshold because current is low and photon emission dominates.
As temperature increases, the band gap of the semiconductor decreases slightly, causing the threshold voltage to fall.
This happens because higher temperatures provide additional energy to electrons, allowing photon emission at lower applied voltages.
To minimise error:
Keep the circuit switched on for short periods to reduce heating.
Allow LEDs to cool between measurements or use a temperature-controlled setup.
