
OCR Specification focus:
‘Use pV = nRT; investigate Boyle’s law and pressure–temperature relations; estimate absolute zero.’
The Equation of State and Gas Laws
The equation of state connects the pressure, volume, temperature, and amount of gas, forming the foundation of ideal gas behaviour and relationships between key measurable quantities in physics.
The Ideal Gas and Its Equation of State
An ideal gas is a theoretical model that describes the behaviour of gases under a wide range of conditions using simple assumptions. It assumes negligible intermolecular forces, perfectly elastic collisions, and molecules of negligible volume. The macroscopic behaviour of an ideal gas is summarised by the equation of state.
EQUATION
—-----------------------------------------------------------------
Ideal Gas Equation (pV = nRT)
p = Pressure of the gas (Pa)
V = Volume occupied by the gas (m³)
n = Amount of substance in moles (mol)
R = Universal gas constant (8.31 J mol⁻¹ K⁻¹)
T = Absolute temperature (K)
—-----------------------------------------------------------------
This equation shows that pressure, volume, and temperature are interdependent: if one changes, at least one of the others must adjust to maintain the equality.
The Gas Laws and Their Relationships
The gas laws are special cases of the equation of state where one variable remains constant. They describe experimentally observed relationships between pressure, volume, and temperature for a fixed amount of gas.
Boyle’s Law (Pressure–Volume Relationship)
Boyle’s law explores how pressure and volume relate when temperature is held constant. It demonstrates that for a fixed mass of gas at constant temperature, pressure is inversely proportional to volume.
EQUATION
—-----------------------------------------------------------------
Boyle’s Law (pV = constant)
p = Pressure (Pa)
V = Volume (m³)
—-----------------------------------------------------------------
When the volume of a gas decreases, the same number of molecules collide more frequently with the container walls, increasing pressure. The p–V graph at constant temperature (an isotherm) produces a smooth hyperbolic curve.
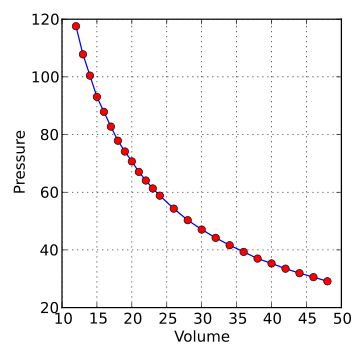
A labelled graph showing Boyle’s law: pressure is inversely proportional to volume for a fixed amount of gas at constant temperature. The curve is a rectangular hyperbola (an isotherm), consistent with pV = constant. Doubling pressure halves volume, provided temperature and amount of gas remain fixed. Source.
Doubling the pressure halves the volume, provided temperature and the amount of gas remain constant.
Key relationships:
p₁V₁ = p₂V₂ for constant temperature.
The curve is asymptotic to both axes, meaning the gas never reaches zero volume or infinite pressure in reality.
Charles’s Law (Temperature–Volume Relationship)
Charles’s law investigates how volume varies with temperature when pressure is constant. It shows that the volume of a fixed amount of gas is directly proportional to its absolute temperature (in kelvin).
EQUATION
—-----------------------------------------------------------------
Charles’s Law (V/T = constant)
V = Volume (m³)
T = Absolute temperature (K)
—-----------------------------------------------------------------
If the gas is heated while pressure is kept constant, its volume expands as the average kinetic energy of molecules increases. When plotted, a graph of V against T (°C) is a straight line that intercepts the temperature axis at –273 °C, corresponding to 0 K, the theoretical absolute zero. This temperature marks the point where molecular motion ceases and the gas would have zero volume if ideal behaviour held.
The Pressure–Temperature Relationship (Pressure Law)
At constant volume, the pressure of a gas is directly proportional to its absolute temperature. This is sometimes referred to as Gay-Lussac’s Law or the pressure law.
EQUATION
—-----------------------------------------------------------------
Pressure Law (p/T = constant)
p = Pressure (Pa)
T = Absolute temperature (K)
—-----------------------------------------------------------------
As temperature rises, gas molecules gain kinetic energy and strike container walls more frequently and forcefully, raising pressure. For a given mass and fixed volume of gas:
p₁/T₁ = p₂/T₂ (when volume is constant).
A graph of p versus T gives a straight line passing through the origin (in kelvin).
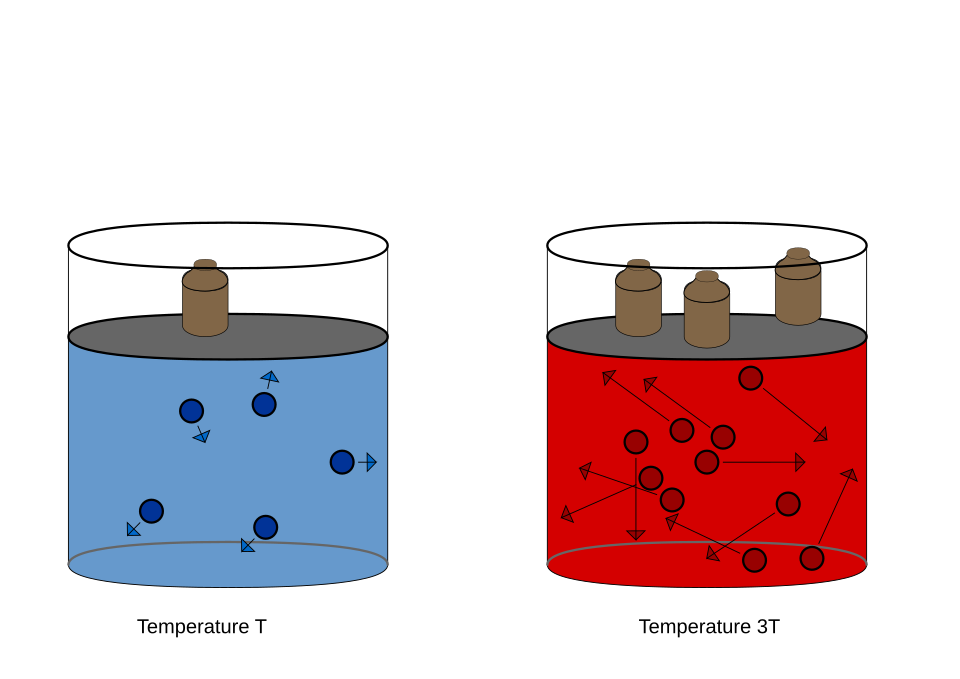
Diagram of the pressure law at constant volume, demonstrating direct proportionality between pressure and absolute temperature. The straight-line p–T graph passes through the origin when temperature is in kelvin. This is the isochoric case of the ideal gas equation pV = nRT. Source.
This relationship forms the basis for experimental estimation of absolute zero. By measuring gas pressure at several known temperatures and extrapolating to p = 0, one can determine the corresponding temperature at which pressure theoretically becomes zero, approximating 0 K.
Experimental Connections Between Gas Laws
Each of the individual gas laws arises from holding one variable constant in the ideal gas equation:
Boyle’s law: T constant → pV = constant
Charles’s law: p constant → V/T = constant
Pressure law: V constant → p/T = constant
These laws are interconnected expressions of the same underlying relationship embodied in pV = nRT. Together, they describe how real gases behave under many conditions, especially at moderate temperatures and pressures where deviations from ideality are minimal.
Behaviour and Implications of the Ideal Gas Equation
The equation pV = nRT implies several practical and theoretical outcomes:
Proportionality relationships:
At constant n and T, p ∝ 1/V (Boyle’s law).
At constant p and n, V ∝ T (Charles’s law).
At constant V and n, p ∝ T (pressure law).
Amount of substance: Increasing n (more moles) increases pV proportionally.
Absolute temperature: Temperature must always be measured in kelvin for proportionalities to hold correctly, since 0 K represents the zero of thermal energy.
Absolute zero: The lowest possible temperature, 0 K, at which particles have minimum internal energy and no further heat can be removed from the system.
Although no gas can truly reach absolute zero, the extrapolation of p–T or V–T graphs provides an experimental method for estimating its value.
Investigating the Equation of State Experimentally
Investigating Boyle’s Law
Trap a known mass of gas in a sealed tube.
Vary pressure using a piston or column of mercury.
Measure corresponding volumes at constant temperature.
Plot p against 1/V to obtain a straight line through the origin.
Investigating the Pressure–Temperature Relationship
Keep gas volume fixed using a sealed container.
Measure pressure with a pressure sensor while heating the gas at different temperatures.
Plot p against T (in kelvin) to confirm direct proportionality.
Both investigations highlight the empirical foundation of the ideal gas equation and provide an avenue to estimate absolute zero by extrapolating linear relationships to the point where gas pressure or volume becomes zero.
Real Gases and Limitations
Real gases approximate ideal behaviour only under specific conditions:
Low pressures: Intermolecular forces and finite molecular volume become negligible.
High temperatures: Particles have sufficient kinetic energy to overcome attractive forces.
Far from liquefaction: Gases deviate significantly near condensation points.
At extreme conditions, real gases require modified models, such as the Van der Waals equation, but for most laboratory and atmospheric applications, pV = nRT remains an accurate and powerful model of gaseous behaviour within the OCR A-Level framework.
Practice Questions
Question 1 (3 marks)
State the relationship between the pressure and volume of a fixed mass of gas at constant temperature. Explain the molecular basis for this relationship.
Mark scheme:
1 mark: States that pressure is inversely proportional to volume (p ∝ 1/V or pV = constant).
1 mark: Explains that when volume decreases, molecules collide more frequently with the container walls.
1 mark: Notes that each collision transfers momentum, increasing the total force per unit area (pressure).
Question 2 (5 marks)
A sealed container of fixed volume contains an ideal gas. The temperature of the gas is increased from 300 K to 450 K.
(a) Describe and explain, in terms of molecular motion, what happens to the pressure of the gas.
(b) Explain how an experiment based on this relationship can be used to estimate the value of absolute zero.
Mark scheme:
(a) (3 marks)
1 mark: States that pressure increases as temperature increases.
1 mark: Explains that average kinetic energy of gas molecules increases with temperature.
1 mark: Notes that molecules collide more frequently and with greater momentum change, exerting a larger force on container walls.
(b) (2 marks)
1 mark: States that by measuring pressure at different known temperatures (at constant volume), a graph of pressure against temperature can be plotted.
1 mark: Explains that extrapolating the straight line to where pressure equals zero gives an estimate of absolute zero (0 K).
FAQ
The ideal gas model assumes:
Gas molecules have negligible volume compared to the container.
Intermolecular forces are negligible.
Collisions are perfectly elastic.
Molecules move randomly and obey Newton’s laws.
These assumptions simplify calculations and explain macroscopic gas behaviour, such as the pV = nRT relationship. They are valid under moderate temperatures and low pressures, where deviations from real gas behaviour are minimal.
Kelvin is an absolute scale starting at absolute zero (0 K), where molecular motion theoretically stops.
In gas equations, proportionalities such as V ∝ T or p ∝ T hold true only when temperature is expressed in kelvin. Using Celsius would produce incorrect results because the zero point (–273 °C) does not correspond to zero thermal energy.
When plotting pressure against temperature to estimate absolute zero:
Inaccurate temperature readings can shift the line and change the intercept.
Non-ideal gas behaviour (especially at high pressures) may distort proportionality.
Leaks or changes in gas quantity affect the accuracy of pressure measurements.
Using small, consistent temperature increments and ensuring constant gas volume help reduce systematic and random errors.
If the number of moles (n) of gas changes, the ideal gas equation shows that pV/T varies directly with n.
For instance, if gas escapes or enters the system:
Increasing n increases pressure or volume at constant temperature.
Decreasing n lowers pressure or volume.
Accurate control and measurement of n are therefore crucial in experiments verifying gas laws.
At high pressures, gas molecules are close together, and their finite size becomes significant.
At low temperatures, intermolecular attractions cause the measured pressure to be lower than predicted.
These deviations occur because the ideal gas model neglects molecular volume and forces. Under such conditions, real gases may liquefy or require corrections, such as those in the Van der Waals equation, to describe their behaviour accurately.
