
OCR Specification focus:
‘Sketch and interpret energy–displacement graphs for a simple harmonic oscillator.’
Energy–displacement graphs for a simple harmonic oscillator illustrate how energy transforms between kinetic and potential forms as displacement changes. These relationships reveal the conservation and interchange of energy throughout oscillation.
Energy in Simple Harmonic Motion
In simple harmonic motion (SHM), the total energy of the system remains constant if there is no damping. The oscillator’s energy continually shifts between kinetic energy (KE), associated with motion, and elastic or potential energy (PE), associated with displacement from equilibrium.
The energy–displacement graph provides a visual representation of how these energy components vary with displacement (x), showing how the system’s energy is stored and released cyclically.
Total Energy of the Oscillator
The total energy in SHM is the sum of kinetic and potential energies and remains constant for an ideal undamped oscillator.
EQUATION
—-----------------------------------------------------------------
Total Energy (E_total) = ½ m ω² A²
m = mass of the oscillator (kg)
ω = angular frequency (rad s⁻¹)
A = amplitude of oscillation (m)
—-----------------------------------------------------------------
This equation shows that total energy depends only on the mass of the oscillator, the angular frequency, and the square of the amplitude. The independence from displacement means that, at any instant, energy is conserved and merely shifts between forms.
Kinetic Energy and Displacement
The kinetic energy of a simple harmonic oscillator arises from its velocity. It is greatest at the equilibrium position, where displacement is zero, and decreases as the oscillator moves toward either extreme of motion.
EQUATION
—-----------------------------------------------------------------
Kinetic Energy (E_k) = ½ m ω² (A² − x²)
x = displacement from equilibrium (m)
—-----------------------------------------------------------------
At x = 0, E_k = ½ m ω² A², its maximum value.
At x = ±A, E_k = 0, because velocity is zero at maximum displacement.
The shape of the kinetic energy curve on an energy–displacement graph is a downward-opening parabola, with its maximum at zero displacement. This parabola visually demonstrates that the kinetic energy decreases symmetrically as the displacement increases in either direction.
Potential Energy and Displacement
The potential energy in SHM is the stored energy due to displacement from the equilibrium position. For a mass–spring system, it represents the elastic potential energy stored in the spring.
EQUATION
—-----------------------------------------------------------------
Potential Energy (E_p) = ½ m ω² x²
—-----------------------------------------------------------------
This energy is zero at equilibrium and maximum at maximum displacement (±A). The graph of potential energy versus displacement is an upward-opening parabola, reflecting the direct proportionality of potential energy to the square of displacement.
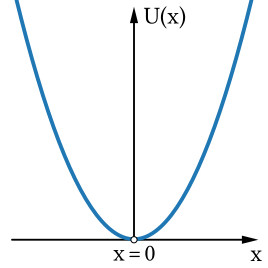
The elastic potential energy of a Hooke’s-law oscillator varies with displacement as U(x) = ½kx², giving an upward-opening parabola with a minimum at x = 0. This captures the energy stored due to displacement from equilibrium that complements the kinetic-energy curve in the full energy–displacement plot. Note: this image shows potential energy only; kinetic and total energy are not depicted here by design. Source.
Between these limits, potential energy rises rapidly with displacement, showing that greater restoring force is needed to displace the oscillator further from equilibrium.
Energy Interchange in SHM
Throughout oscillation, kinetic and potential energies continuously interchange while maintaining a constant total energy.
At maximum displacement (x = ±A):
Velocity = 0
Kinetic energy = 0
Potential energy = maximum (½ m ω² A²)
At equilibrium (x = 0):
Displacement = 0
Potential energy = 0
Kinetic energy = maximum (½ m ω² A²)
At intermediate positions (0 < |x| < A):
Both energies coexist and vary inversely
Their sum remains constant, maintaining total energy conservation
This energy exchange occurs twice during each complete oscillation—once for each direction of motion—making it a fundamental characteristic of simple harmonic oscillators.
Graphical Representation of Energy–Displacement Relationships
Shape and Characteristics of the Graphs
The energy–displacement graph includes three distinct curves plotted against displacement (x):
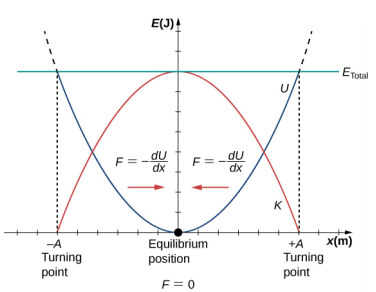
A graph of K (red), U (blue) and Eₜₒₜₐₗ (green) versus displacement x. K peaks at x = 0 and falls to zero at x = ±A, while U does the opposite; their sum is constant and equal to ½kA². The turning points x = ±A and the equilibrium x = 0 are clearly indicated. Source.
Potential Energy Curve (E_p):
Parabolic curve opening upwards.
Starts at zero when x = 0 and reaches a maximum at ±A.
Represents energy stored due to displacement.
Kinetic Energy Curve (E_k):
Parabolic curve opening downwards.
Maximum at x = 0 and zero at ±A.
Illustrates the oscillator’s motion energy.
Total Energy Line (E_total):
A horizontal straight line showing constant total energy.
Equal to ½ m ω² A² for all values of x.
The intersection points where E_k and E_p sum to the constant E_total demonstrate energy conservation clearly: at any position, the sum of the two energy components equals the total.
Interpreting the Graph
When interpreting energy–displacement graphs, students should understand the relationship between displacement, velocity, and energy transfer:
As the object moves from equilibrium toward maximum displacement, kinetic energy converts into potential energy.
As it returns toward equilibrium, potential energy converts back into kinetic energy.
The rate of energy transfer is greatest near equilibrium, where velocity is highest, and slowest near the extremes, where motion briefly pauses before reversing direction.
These interpretations apply universally to undamped oscillators such as a mass on a spring or a pendulum at small angles, assuming negligible energy loss.
Energy Graph Symmetry and Dependence on Amplitude
The symmetry of energy–displacement graphs about the equilibrium position is a direct result of the oscillator’s isochronous and harmonic nature. Both E_k and E_p depend on the square of displacement, leading to identical energy patterns on either side of equilibrium.
Changing the amplitude (A) affects the scale of energy values but not their shape:
Doubling the amplitude increases total energy by a factor of four (since E_total ∝ A²).
The graphs stretch vertically to reflect this higher total energy but retain their parabolic forms.
The oscillator’s frequency remains unchanged, since amplitude does not affect the time period of SHM.
Summary of Key Graph Features
To effectively sketch and interpret energy–displacement graphs, students should remember:
Total energy is constant, represented by a straight horizontal line.
Potential energy increases with displacement squared.
Kinetic energy decreases with displacement squared.
The sum of kinetic and potential energies at any displacement equals the total energy.
Graph symmetry reflects equal energy behaviour on both sides of equilibrium.
Understanding these graphical relationships is vital for recognising how energy conservation governs motion in all simple harmonic systems.
Practice Questions
Question 1 (2 marks)
Sketch and label the variation of kinetic energy with displacement for a simple harmonic oscillator.
Mark Scheme:
1 mark: Correct shape — a downward-opening parabola symmetric about the equilibrium position (x = 0).
1 mark: Correctly labelled axes and key points — kinetic energy maximum at x = 0, zero at x = ±A.
Question 2 (5 marks)
A mass–spring system performs simple harmonic motion with amplitude A and angular frequency ω.
(a) Derive an expression for the total energy of the system in terms of m, ω, and A.
(b) Using appropriate equations, explain how the kinetic and potential energies of the system vary with displacement, and describe how they are represented on an energy–displacement graph.
Mark Scheme:
(a) 1 mark: States or derives E_total = ½ m ω² A².
(a) 1 mark: Correctly identifies that total energy remains constant and is independent of displacement.
(b) 1 mark: States E_k = ½ m ω² (A² − x²) and/or E_p = ½ m ω² x².
(b) 1 mark: Explains that as displacement increases, kinetic energy decreases and potential energy increases, maintaining constant total energy.
(b) 1 mark: Describes or sketches how E_k and E_p form opposing parabolic curves on an energy–displacement graph, with their sum equal to E_total throughout.
FAQ
The curvature of the parabolic energy–displacement graphs is determined by the term mω² in the energy equations.
A larger angular frequency (ω) or mass (m) steepens both potential and kinetic energy curves, as energy changes more rapidly with displacement.
The shape remains parabolic because energy always varies with the square of displacement (x²).
This means that for oscillators with higher stiffness or frequency, energy increases sharply with small changes in displacement.
Total energy remains constant because energy is continually exchanged between kinetic and potential forms within the system.
When potential energy increases, kinetic energy decreases by the same amount.
There are no energy losses in an ideal system, so the sum of both remains fixed.
This conservation follows from the fact that the restoring force and acceleration are directly proportional to displacement, ensuring periodic energy transfer.
With damping, mechanical energy is gradually lost to the surroundings as heat or sound.
The total energy line would no longer be horizontal; it would decrease with time, showing diminishing amplitude.
The kinetic and potential energy parabolas would shrink over successive oscillations, maintaining their shape but with smaller maximum values.
Although the relationship between displacement and instantaneous energy remains parabolic, the overall energy envelope decays exponentially.
Not accurately. The graphs in this subsubtopic assume Hooke’s law behaviour, where force is proportional to displacement.
In non-linear oscillations, restoring force does not follow F = −kx.
This causes potential energy to deviate from the simple ½kx² relationship.
Resulting energy–displacement graphs become asymmetric or distorted, and total energy may not remain constant.
Therefore, the classic parabolic graphs only apply to systems obeying simple harmonic motion conditions.
Amplitude influences the maximum energy values, not the graph’s shape.
Total energy ∝ A², so doubling amplitude quadruples total, potential, and kinetic energy maxima.
The energy curves stretch vertically but maintain their parabolic symmetry and intercepts at ±A.
Thus, greater amplitude means higher stored and kinetic energy, but the oscillator’s frequency and graph curvature remain unchanged.
