
OCR Specification focus:
‘For point or spherical masses, work done equals the area under the force–distance graph.’
Gravitational force–distance graphs provide a powerful visual way to understand how work is done by gravitational fields when objects move, helping students connect force variation with energy changes.
Section 1: The Role of Force–Distance Graphs in Gravitational Physics
Force–distance graphs are central to analysing how gravitational forces change with separation between masses. In gravitational systems involving point or spherical masses, the force is not constant: it decreases with increasing distance. As required by the OCR specification, the work done is determined by the area under the force–distance graph, linking graphical interpretation directly to energy concepts.
Understanding Gravitational Force Variation
In Newtonian gravitation, the force on a small mass m due to a large mass M acts along the line joining them and decreases with the square of the separation.
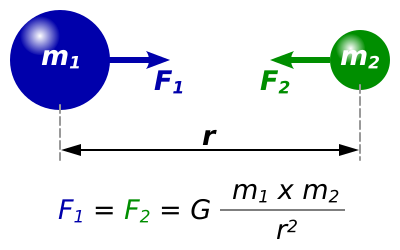
Diagram illustrating Newton’s law of universal gravitation between two point masses separated by distance rrr, with forces shown along the line of centres. This clarifies the central and distance-dependent nature of gravitational force. The equation presented forms the basis for understanding how force varies with distance on force–distance graphs. Source.
Because this force is not uniform, work done cannot be found simply with F × d.
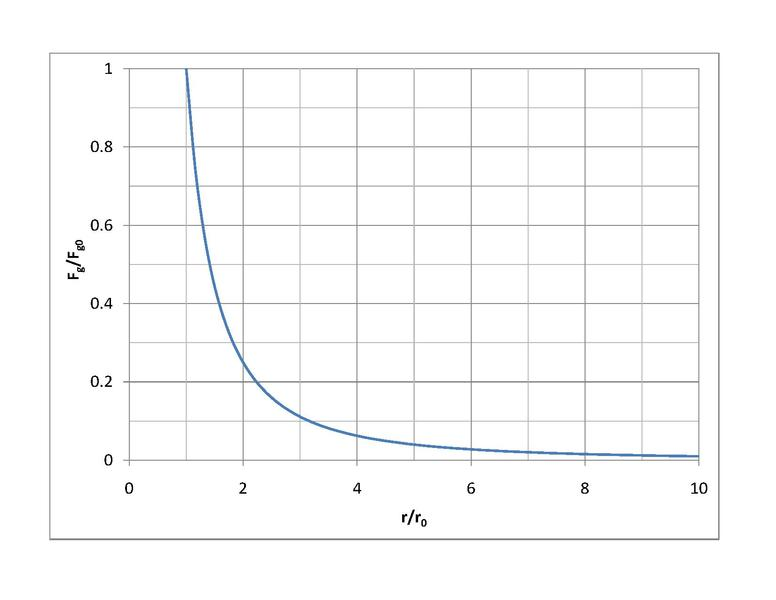
Graph showing gravitational force declining with distance from a planet, based on Newton’s gravitational force equation. The curve demonstrates the inverse-square dependence of force on separation. The area beneath this curve corresponds to the work done by or against gravity when moving a mass between two distances. Source.
The Meaning of Work in Gravitational Fields
Whenever an object moves in a gravitational field, the field either does work on the object or work is done against the field. This connects force–distance graphs to gravitational potential energy, because the area under the force–distance curve corresponds to the energy transferred.
Section 2: Defining Key Terms
When discussing this topic, students must be precise with the meaning of key terms related to gravitational interactions.
Work done: The energy transferred when a force causes a displacement in the direction of that force.
The work done in gravitational contexts can be positive or negative, depending on whether the field aids or opposes motion. This sign convention becomes particularly important when interpreting the geometry of force–distance graphs.
Section 3: Gravitational Force Between Point or Spherical Masses
The OCR specification emphasises point and spherical masses because such objects generate gravitational fields that are spherically symmetric. A spherically symmetric mass behaves as though all of its mass is concentrated at its centre, allowing the force to be treated as a function of distance alone. This simplifies the force–distance relationship to a single curve.
EQUATION
—-----------------------------------------------------------------
Gravitational Force (F) = −GMm / r²
G = Gravitational constant (N m² kg⁻²)
M = Mass of the larger body (kg)
m = Mass of the smaller body (kg)
r = Separation between centres of mass (m)
—-----------------------------------------------------------------
Because the force is inversely proportional to r², the graph of F against r is a curve that becomes less steep as distance increases.
A key point for OCR students is that only radial distance matters, reinforcing why the force–distance graph is valid even for spherical planets or stars.
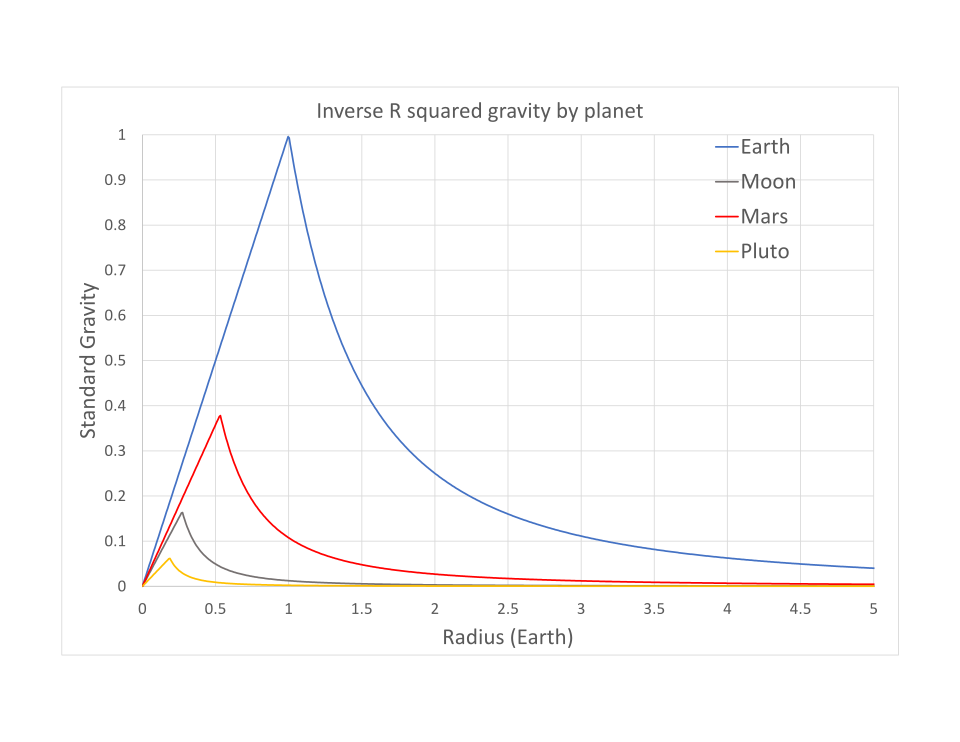
Graph comparing gravitational field strength with distance from the centre of several spherical bodies. Each curve shows gravity decreasing with radial distance in accordance with inverse-square behaviour. The interior linear regions assume uniform density and go slightly beyond OCR requirements, serving as optional enrichment. Source.
Section 4: Using Force–Distance Graphs to Determine Work Done
A force–distance graph places force on the vertical axis and displacement on the horizontal axis. The area under the curve represents the work done, following from the definition of work as the integral of force with respect to displacement.
Why the Area Represents Work
For small changes in distance, the gravitational force may be assumed approximately constant, and work done becomes FΔr. Adding up (integrating) all the small contributions gives the total work done over a finite distance. In a graph, this total is visualised as the area beneath the force curve.
Because the gravitational force is negative (attractive), the graph lies below the horizontal axis. Consequently:
A negative area indicates work done by the gravitational field.
A positive area (when considering magnitude or performing work against the field) corresponds to an energy input to increase separation.
Important Features to Note on These Graphs
Students should carefully observe the following features:
Curve shape: The steepness near small r reflects strong force when masses are close.
Asymptotic behaviour: As r increases, the curve approaches zero, showing the weakening field.
Area magnitude: Larger areas near small r indicate large work done when moving objects close to massive bodies.
These characteristics help explain why escaping a planet’s gravitational field requires significant energy near the surface but comparatively less extra energy once far away.
Step-by-Step Use of the Graph
Although full worked examples are excluded in this page, OCR students should internalise the general process:
Identify the initial and final separation distances.
Read the gravitational force value on the curve at relevant points.
Interpret the area between the curve and the r-axis between the chosen limits.
Recognise whether the work done is by or against the field.
Section 5: Connecting Work Done to Gravitational Potential Energy
When work is done against the gravitational field to increase separation, the object gains gravitational potential energy. Conversely, when the field does work, gravitational potential energy decreases. Force–distance graphs therefore serve as a bridge between force-based and energy-based descriptions of gravitational interactions.
After calculating or interpreting the area under the force curve, the result corresponds directly to the change in gravitational potential energy, reinforcing the unified nature of gravitational physics within the OCR specification.
Section 6: Practical Uses of Force–Distance Graphs
Force–distance graphs allow students to:
Visualise non-constant gravitational forces.
Predict how much energy is needed to move objects between orbits or escape a gravitational field.
Understand how gravitational interactions scale over large distances.
Interpret the geometry of curves for theoretical or astronomical scenarios.
These skills form an essential foundation for later study of gravitational potential and orbital mechanics.
Practice Questions
Question 1 (2 marks)
A student states:
“The gravitational force on a spacecraft decreases as it moves further from a planet. On a force–distance graph, the work done by gravity as the spacecraft moves from distance r1 to r2 is represented by the area under the curve.”
Explain why the area under the force–distance graph corresponds to the work done by gravity.
Question 1 (2 marks)
1 mark: States that work done equals force multiplied by displacement when force acts along the direction of motion, or mentions integrating force over distance.
1 mark: Explains that the area under the force–distance graph represents the sum (or integral) of small contributions of force multiplied by small distance intervals, giving total work done.
Question 2 (5 marks)
A probe of mass m is moved slowly away from the surface of a spherical planet of mass M.
The gravitational force F acting on the probe varies with distance r from the planet’s centre according to the relationship F = GMm / r^2.
(a) Sketch the general shape of the force–distance graph for this probe, labelling both axes clearly.
(b) Explain how you would use this graph to determine the work done in moving the probe from radius rA to rB (where rB > rA).
(c) State whether this work is done by the gravitational field or against the gravitational field, and justify your answer.
Question 2 (5 marks)
(a) Sketch (2 marks):
1 mark: Force decreases with increasing distance (curve slopes downward, approaching zero but never reaching it).
1 mark: Axes correctly labelled (force on vertical axis, distance from planet’s centre on horizontal axis).
(b) Determining work done (2 marks):
1 mark: States that work done is equal to the area under the force–distance graph between rA and rB.
1 mark: Mentions that this area corresponds to the integral of the variable force with respect to distance.
(c) Work by or against field (1 mark):
1 mark: States that the work is done against the gravitational field because gravitational force acts towards the planet while the motion is away from it (or equivalent wording).
FAQ
The general shape remains the same because gravitational force always follows an inverse-square relationship. However, the scale of the graph changes significantly.
For a more massive central body, the curve starts at a much larger force for small radii and decreases more steeply.
For a less massive body, the graph lies much closer to the horizontal axis but still follows the same mathematical form.
The shape is identical in form, but the magnitude differs.
In gravitational physics, the force is taken as negative because it acts towards the centre of mass. If radial distance is plotted as positive outward, the force lies below the horizontal axis.
This means:
The graph’s area is negative when the force assists the motion.
A negative area corresponds to energy transferred from the gravitational field to the object.
This sign convention helps to distinguish between work done by and work done against the field.
Gravitational force decreases rapidly with distance, meaning that even small changes in radius cause noticeable variation in force.
For example:
A few kilometres of altitude create a detectable reduction in gravitational force near Earth.
Because the decrease follows an inverse-square law, the gradient of change remains significant unless the object is extremely far from the planet.
This makes constant-force approximations unsuitable for accurate work calculations over realistic distances.
The steepest parts of the curve represent regions where gravitational force is strongest. A larger downward gradient indicates that small changes in radius correspond to large differences in force.
This means:
Most work is required (or released) when moving objects close to massive bodies.
At large distances, the curve becomes shallow, meaning additional distance changes contribute very little additional work.
This understanding guides qualitative predictions of energy requirements in gravitational systems.
The inverse-square relationship ensures the curve has a distinctive shape that approaches zero asymptotically. This feature means the work done over a large distance remains finite even though the graph never touches the axis.
Because the force reduces quickly, the majority of the work is associated with the region close to the mass.
Understanding this helps students interpret why the area under the curve converges and why escaping gravitational influence does not require infinite energy.
