
OCR Specification focus:
‘Photon emission accompanies downward transitions with hf = ΔE and hc/λ = ΔE.’
Emission lines arise when electrons in atoms drop to lower energy levels, releasing photons with specific energies. These photons produce characteristic wavelengths, underpinning stellar spectral analysis.
Emission Processes in Atoms
Understanding how emission lines form is fundamental to interpreting radiation from stars. Emission lines directly reflect changes in internal atomic energy.
Emission line: A bright spectral feature produced when an atom emits photons at discrete wavelengths during electron transitions to lower energy levels.
When an atom absorbs energy through heating or excitation, its electrons can occupy higher energy levels temporarily. The atom then becomes unstable in this excited configuration, meaning the probability of returning to a lower state becomes significant. As electrons fall back down the energy ladder, they release photons with energies determined precisely by the difference between the two levels.

Hydrogen’s quantised energy levels are shown as discrete horizontal lines. When an electron moves downward between levels, it emits a photon whose energy matches the separation between those levels. Source.
These discrete transitions occur because electrons in isolated atoms possess quantised energy levels. Each permitted level corresponds to a fixed negative energy relative to the ionisation threshold. Since these levels are fixed for each element, the emitted photons have predictable energies and produce identifiable lines.
Energy Transitions and Photon Production
Electron transitions occur between well-defined atomic states. The energy lost when an electron moves to a lower state must appear elsewhere, and in emission the energy is carried away by a photon. This is central to the OCR statement that photon emission accompanies downward transitions.
EQUATION
—-----------------------------------------------------------------
Photon Energy (E) = hf
h = Planck’s constant (J s)
f = frequency of emitted photon (Hz)
—-----------------------------------------------------------------
Because frequency and wavelength are inversely related, the photon energy is also expressible in terms of wavelength. Both forms highlight that each transition produces a photon of a single, sharply defined energy.
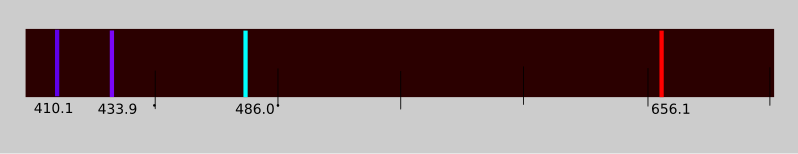
The visible emission spectrum of hydrogen shows narrow Balmer lines at specific wavelengths. Each line corresponds to a photon emitted during a particular downward electronic transition. Source.
A sentence is required before another block. The equivalence with wavelength reflects the wave-like characteristics of electromagnetic radiation.
EQUATION
—-----------------------------------------------------------------
Photon Energy–Wavelength Relation (E) = hc/λ
h = Planck’s constant (J s)
c = speed of light in vacuum (m s⁻¹)
λ = wavelength of emitted photon (m)
—-----------------------------------------------------------------
Both forms highlight that each transition produces a photon of a single, sharply defined energy. This leads to the narrow, bright lines in an emission spectrum. Because the energy differences between allowed levels vary in magnitude, atoms produce a spectrum of discrete emission lines, not a continuum.
The Structure of Atomic Energy Levels
Electrons within atoms occupy stable quantised states, each with a distinct energy. These levels converge at the ionisation limit and become more closely spaced at higher energies. When an electron transitions between levels, the energy gap determines the photon's characteristics.
The structure of energy levels can vary significantly between atoms due to differences in nuclear charge and electron–electron interactions. These distinctions create an unequal ladder of possible transitions. Consequently, each chemical element emits a unique arrangement of spectral lines, enabling identification of stellar material.
Formation of Emission Spectra
An emission spectrum is a graphical record of the intensities of light at different wavelengths. Hot, low-density gases in astronomical environments commonly produce such spectra. In these conditions, atoms remain sufficiently isolated for discrete electron transitions to occur without significant broadening or smearing of energy levels.
Key features of emission spectra include:
Bright lines at specific wavelengths corresponding to photon emission.
Dark background where no significant emission occurs.
Wavelength separation reflecting energy differences between atomic levels.
Element-specific patterns enabling chemical analysis.
These features arise naturally from the quantum mechanical rules governing how electrons behave in bound systems. Emission lines remain narrow because transitions occur between sharply defined energy states and because low gas density minimises collisions.
Photons and Electromagnetic Properties
Each emitted photon carries both particle-like and wave-like properties. From a particle viewpoint, its energy is fixed by the atomic transition, meaning it behaves as a discrete packet of energy. From a wave viewpoint, its wavelength and frequency form part of the electromagnetic spectrum.
Because frequency and wavelength are inversely related, the photon energy is also expressible in terms of wavelength.
Understanding emission lines therefore links atomic physics with astrophysical observation. Because stars contain hot, diffuse gases with atoms undergoing repeated excitation and de-excitation, their emitted light often includes characteristic emission signatures, particularly from outer layers, nebulae, or energetic regions.
Observational Applications
Emission lines are invaluable in astrophysics. Their quantised nature allows scientists to:
Determine the chemical composition of stellar and interstellar gases.
Identify ionisation states, which indicate temperature and density.
Measure radial velocities through Doppler shifts of known wavelengths.
Detect energetic astrophysical phenomena, such as recombination in nebulae.
Study thermodynamic processes, since emission mechanisms depend on excitation sources.
These uses stem directly from the fundamental physics that photon emission accompanies downward transitions with energies determined by hf = ΔE or hc/λ = ΔE, ensuring emission lines remain powerful diagnostic tools in modern astrophysics.
Practice Questions
Question 1 (2 marks)
An electron in an atom undergoes a transition from a higher energy level to a lower energy level. Explain why a photon is emitted during this process and state the relationship between the photon energy and the change in atomic energy levels.
Mark Scheme:
• Electron loses energy when moving to a lower energy level / energy difference must be released. (1 mark)
• A photon is emitted with energy equal to the energy difference between the levels, given by E = hf or E = hc/λ. (1 mark)
Question 2 (5 marks)
Hydrogen gas in a low-density nebula emits a series of bright emission lines.
(a) Explain why these emission lines occur at discrete wavelengths.
(b) Describe how measurements of these emission lines can be used to determine both the elements present and the physical conditions within the nebula.
(c) State and use the relevant equation(s) that relate photon energy to frequency or wavelength, without performing any numerical calculations.
Mark Scheme:
(a)
• Electrons in atoms occupy quantised / discrete energy levels. (1 mark)
• Transitions between these levels release photons of fixed energies, producing discrete wavelengths. (1 mark)
(b)
• Each element has a unique set of energy levels, so emission line patterns act as fingerprints to identify elements present. (1 mark)
• Line intensities / ratios indicate temperature, excitation or density conditions in the nebula. (1 mark)
(c)
• States the correct relation E = hf or E = hc/λ. (1 mark)
(Only one equation required for the mark; no calculation needed.)
FAQ
The time an electron stays in an excited state is known as the lifetime of that state, and it varies depending on the specific energy level and atom.
This lifetime is influenced by the probability of spontaneous emission, which is governed by quantum mechanical transition rules.
Some excited states are “forbidden” or weakly allowed, so electrons may remain in them for significantly longer, producing faint but detectable emission lines in astronomical sources.
Emission line intensity depends on how many electrons undergo the same transition and how efficiently they are excited into the upper energy level.
Factors influencing intensity include:
• Temperature: higher temperatures increase excitation rates.
• Density: too high a density increases collisions, which can suppress certain transitions.
• Abundance: elements present in larger quantities naturally produce stronger lines.
Yes, an electron excited to a high energy level may drop through several intermediate levels rather than fall directly to the ground state.
Each step releases a photon, so a single excitation event can produce multiple emission lines.
This cascading effect explains why some spectral series, like the Balmer or Lyman series, contain many closely related lines originating from different downward pathways.
Although ideal emission lines are narrow, physical conditions can broaden them.
Main broadening mechanisms include:
• Doppler broadening caused by thermal motion of atoms.
• Pressure broadening due to collisions affecting energy levels.
• Natural broadening from the finite lifetimes of excited states.
In low-density gases, Doppler broadening tends to dominate, giving each line a characteristic Gaussian shape.
Ionised atoms have different energy-level structures compared with their neutral counterparts, so they produce distinct sets of emission lines.
The degree of ionisation reflects the temperature and radiation environment.
In hot astrophysical regions, highly ionised species such as He II or O III produce strong emission lines that provide diagnostic clues about energetic processes and the physical conditions of the gas.
