
OCR Specification focus:
‘Plot p.d.–charge graphs for a capacitor; energy stored equals the area under the graph.’
A capacitor’s behaviour can be visualised effectively using voltage–charge relationships, and understanding V–Q graphs allows students to interpret how electrical energy is stored and released within capacitor systems.
Understanding V–Q Graphs
A V–Q graph shows how the potential difference (voltage) across a capacitor varies with the charge it stores. For an ideal capacitor, this graph is a straight line passing through the origin, indicating proportionality between the two quantities. This linearity reflects a fundamental property of capacitors: as more charge accumulates on the plates, the potential difference rises at a constant rate determined by the capacitor’s physical construction.
Capacitance: The ratio of charge stored on a capacitor to the potential difference across it.
The straight-line nature of a V–Q graph is an essential graphical representation of this definition. The gradient of the line corresponds to the inverse of capacitance, meaning that a steeper gradient indicates a smaller capacitance, and a shallower gradient indicates a larger capacitance. Students should recognise that this proportional relationship is central to interpreting and comparing different capacitors using graphical information.
The Linear Relationship Between Voltage and Charge
For an ideal capacitor, voltage and charge rise together predictably, and this proportionality underpins the energy relationships used in circuit analysis. It also allows the V–Q graph to be used as a visual tool for determining how much work must be done to store electrical energy on the capacitor plates.
EQUATION
—-----------------------------------------------------------------
Capacitor Charge–Voltage Relationship (Q, V, C) = Q = C V
Q = Charge stored on the capacitor, measured in coulombs (C)
C = Capacitance, measured in farads (F)
V = Potential difference across the capacitor, measured in volts (V)
—-----------------------------------------------------------------
Because the graph is linear, the area under the V–Q line has a geometric interpretation that directly links the graph to stored energy.
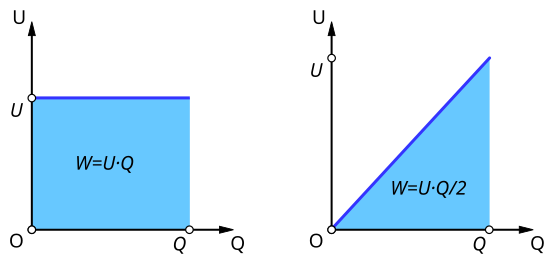
Diagram illustrating electrical work as the area under a graph. The right-hand panel visually reinforces that a straight-line V–Q graph forms a triangular area corresponding to W = ½QV. Source.
Before exploring this further, it is important for students to appreciate that any changes to capacitance—such as altering plate area or separation—would change the slope of the V–Q graph without altering its overall straight-line form.
Energy Stored in a Capacitor
The energy stored in a capacitor corresponds to the work required to move charge onto the plates against the increasing electric field between them. This physical process naturally leads to a triangular area under the straight-line V–Q graph.
Why the Area Under the Graph Represents Energy
As each additional unit of charge is added to the capacitor, a greater potential difference must be overcome. This means the work done is not constant but increases progressively, forming a triangular region when plotted. Students must recognise that this geometric area directly represents total stored electrical energy.
EQUATION
—-----------------------------------------------------------------
Energy Stored in a Capacitor (W, Q, V) = W = ½ Q V
W = Energy stored, measured in joules (J)
Q = Charge stored on the capacitor, in coulombs (C)
V = Potential difference across the capacitor, in volts (V)
—-----------------------------------------------------------------
Between introducing the V–Q relationship and the energy formula, students should see that the triangular area emerges naturally due to the steadily rising potential difference. The factor of one-half in the equation corresponds to the triangular area under the straight-line graph.
Interpreting Graph Features
A well-drawn V–Q graph communicates a range of important physical ideas:
Gradient
Represents 1/C
A steeper gradient means a smaller capacitance
A shallower gradient means a larger capacitance
Area under the graph
Equals the total energy stored
A larger area indicates greater stored energy for a given maximum charge or voltage
Linearity
Shows that the capacitor obeys the ideal Q = C V relationship
Non-linear shapes suggest breakdown or non-ideal behaviour (though such cases are not required for OCR)
Advantages of Using V–Q Graphs
These graphs offer several conceptual benefits for students learning capacitor physics:
They provide a clear visual connection between charge, voltage, and capacitance.
They allow estimation of stored energy even without direct computation, simply by assessing the area under a straight line.
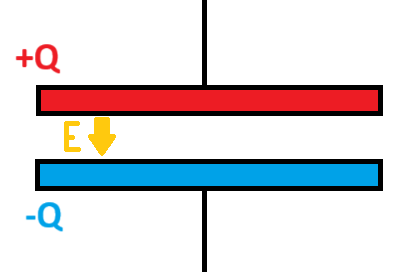
Diagram summarising how capacitors store energy in the electric field between their plates. It includes mathematical relationships for stored energy, presented in Spanish. Some details extend slightly beyond the specific subsubtopic but remain closely relevant and educational. Source.
They reinforce the idea that electrical work is needed to increase charge because voltage rises with each additional coulomb.
The combination of these advantages ensures that V–Q graphs serve not only as a learning aid but also as a tool for analysing circuit behaviour, particularly when reasoning about how capacitors store and release energy.
Techniques for Constructing V–Q Graphs
In practice, V–Q graphs may be generated from experimental data. Students typically collect readings of voltage and corresponding charge values, obtained either by calculating Q from the product C V or by measuring current and integrating with respect to time in more advanced investigations. Regardless of method, clarity and precision in plotting are essential.
When plotting V–Q graphs, students should remember:
Label axes clearly: Charge (C) on the horizontal axis; Potential difference (V) on the vertical.
Ensure consistent units across all data points.
Draw a best-fit straight line through the origin if the capacitor behaves ideally.
Use the gradient to estimate capacitance where appropriate.
These techniques ensure that students can reliably interpret capacitor behaviour and use graphs to connect theoretical relationships with practical electrical measurements.
Practice Questions
Question 1 (2 marks)
A capacitor is charged from zero charge. The graph of potential difference V against charge Q is a straight line through the origin.
Explain what the straight-line relationship shows about the behaviour of the capacitor.
Question 1 (2 marks)
• Straight-line through origin shows Q is directly proportional to V. (1 mark)
• This indicates the capacitor has a constant capacitance / obeys Q = C V. (1 mark)
Question 2 (5 marks)
A student plots a graph of potential difference V against charge Q for a capacitor. The graph is a straight line from the origin up to a maximum charge of 60 microcoulombs at 12 volts.
(a) Describe how the student could use the graph to determine the capacitance of the capacitor.
(b) Explain why the energy stored by the capacitor is represented by the area under the V–Q graph.
(c) Use the graph information to discuss how the energy stored would change if the capacitor could be charged to a higher potential difference while maintaining the same linear relationship.
Question 2 (5 marks)
(a)
• Capacitance is found from the gradient of the V–Q graph. (1 mark)
• Correct statement that C = Q / V using any two values or the gradient concept. (1 mark)
(b)
• Work done to add charge increases as voltage increases. (1 mark)
• Total energy is the sum of all small increments of work, represented as the area under the graph. (1 mark)
(c)
• Charging to a higher V increases the final charge along the same straight-line relationship. (1 mark)
• The triangular area under the graph would be larger, so more energy is stored. (1 mark)
FAQ
The straight-line behaviour arises because the electric field between the capacitor plates increases uniformly as charge builds up, provided plate spacing and dielectric properties remain constant.
This means each additional coulomb of charge requires the same incremental increase in potential difference, leading to a constant ratio of Q to V.
Non-ideal effects such as dielectric saturation or leakage currents can bend the graph slightly, but these do not occur under normal A-Level conditions.
Changing the dielectric does not alter the linear shape of the graph but affects its gradient.
A higher-permittivity dielectric increases capacitance.
Increased capacitance makes the graph shallower because more charge is stored for the same voltage.
Conversely, removing or weakening the dielectric steepens the line.
This occurs because the dielectric reduces the effective electric field, allowing more charge to accumulate before the voltage rises significantly.
Although the line is straight, the energy corresponds to the triangular area under the graph. As V increases, the incremental work done to add charge rises because the electric field becomes stronger.
This means the final portion of the charging process contributes disproportionately to the total stored energy.
The result is that storing extra charge at higher voltages adds significantly more energy than storing the same amount at low voltages.
By plotting several V–Q lines on the same axes, capacitors can be compared visually.
Shallower gradient: larger capacitance.
Steeper gradient: smaller capacitance.
By examining the maximum reachable charge or voltage, students can also compare the energy-storage potential of different capacitors.
A capacitor with a shallow gradient and greater maximum voltage will enclose more area under its graph, meaning it can store more energy.
The area under the graph always represents the energy because the definition of electrical work relies on integrating small increments of charge multiplied by the voltage at that moment.
For an ideal capacitor this integration becomes a triangle, but for non-linear behaviour the method remains:
Divide the curved graph into thin strips.
Multiply each charge increment by its corresponding voltage.
Sum the contributions to obtain the total energy.
This principle holds regardless of the capacitor’s construction or non-ideal features.
