
OCR Specification focus:
‘Interpret force–distance graphs for point or spherical charges; area under the graph equals work done.’
Electric potential energy changes around point or spherical charges can be understood visually and quantitatively using force–distance graphs, which reveal how electric forces vary with separation and how this relates to the work done in moving charges.
Force–Distance Relationships in Electric Fields
A force–distance graph displays how the electric force between two charges changes with their separation. Because interactions between isolated charges depend only on their distance apart, these graphs offer a clear way to connect force behaviour with changes in electric potential energy. When working with electric fields around point or uniformly charged spherical objects, the functional form of the force follows Coulombic behaviour, decreasing rapidly with increasing separation.
Point and Spherical Charge Interactions
Forces between isolated charged objects occur because each charge creates an electric field that acts on the other. When the charges involved are either true point charges or uniformly charged spheres, the interaction depends solely on the radial distance between their centres. The radial symmetry of such systems ensures that the force always acts along the line connecting the two charges. This simplifies the interpretation of force–distance graphs, as the graph will describe a single, well-defined magnitude of force at each separation.
The general shape of the force–distance graph reflects this radial dependence: force values are large at small separations and diminish quickly with increasing distance. Whether the force is attractive or repulsive depends on the signs of the interacting charges, but the magnitude–distance relationship follows the same mathematical pattern.
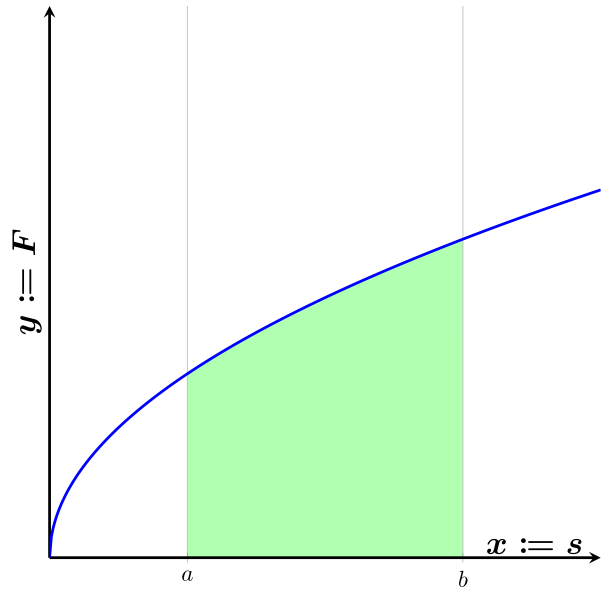
A force–distance diagram highlighting the shaded area that represents the total work done between two positions as force varies with separation. Source.
The work done in moving a charge in an electric field is intimately connected to the area under a force–distance graph.
The Meaning of the Area Under a Force–Distance Graph
The work done in moving a charge in an electric field is intimately connected to the area under a force–distance graph. The specification emphasises that the area represents the total work required to move the charge between two points in space. This provides a powerful visual method for calculating work done without relying solely on algebraic expressions.
Work Done Against or by Electric Forces
When moving a test charge, the direction of motion relative to the direction of the electric force determines whether energy is supplied to or transferred from the field.
If a charge is moved against the electric force, external work must be done on the system, increasing the electric potential energy.
If a charge is moved with the force, the field performs work, and the electric potential energy decreases.
A force–distance graph makes this relationship clear by showing the relative magnitude of force at each position, allowing the cumulative work for any interval to be determined from the graphical area.
Force of a Point Charge
It is often necessary to recall the mathematical form of the force between point charges before interpreting its graphical representation.
EQUATION
—-----------------------------------------------------------------
Coulomb's Law (F) = (1 / 4πɛ₀) · (Qq / r²)
F = Electric force between the charges (newtons)
Q = Charge creating the field (coulombs)
q = Test charge experiencing the force (coulombs)
r = Separation between charges (metres)
ɛ₀ = Permittivity of free space (farads per metre)
—-----------------------------------------------------------------
Because the force varies as 1/r², the graph of force against distance is steep and nonlinear. It begins with very large values at small separations and gradually tapers off as distance increases.
Understanding this mathematical behaviour clarifies why the area under such a graph must be computed carefully: the area does not correspond to a simple geometric shape but must reflect the curved profile of the force.
Relating Graphical Area to Electric Potential Energy
The link between graphical area and potential energy becomes especially important when considering changes in separation between charged particles. The electric potential energy associated with two charges depends entirely on their separation, so force–distance graphs give immediate insight into how this energy varies during motion.
EQUATION
—-----------------------------------------------------------------
Work Done (W) = Area under the F–r graph
W = Work done in moving the charge (joules)
F = Force at each separation (newtons)
r = Distance moved (metres)
—-----------------------------------------------------------------
This relationship applies regardless of whether the charges repel or attract. The sign of the work depends on whether the motion is with or against the electric force, but the magnitude is captured by the area.
The curved nature of the graph means the area must often be found using calculus, though for A-Level specification purposes, the focus is on recognising the meaning of the area and interpreting how larger or smaller areas relate to greater or lesser energy changes. This conceptual understanding is especially valuable when comparing different regions of a graph or considering how modifying the charge magnitudes alters the force profile.
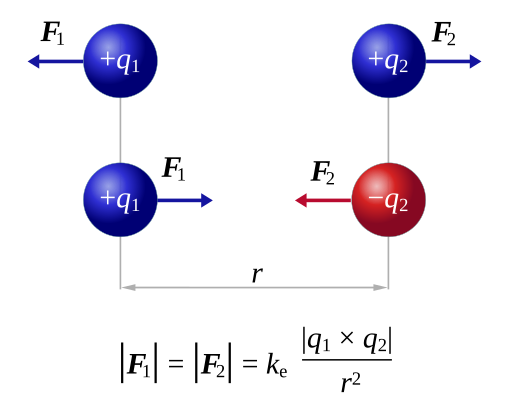
Diagram showing attractive and repulsive forces between point charges, illustrating how the sign of charge determines the force direction while the magnitude follows the same inverse-square dependence. Source.
Whether the force is attractive or repulsive depends on the signs of the interacting charges, but the magnitude–distance relationship follows the same mathematical pattern.
Applications of Force–Distance Interpretation
Force–distance graphs allow students to:
Visualise how electric forces weaken with separation.
Distinguish attractive from repulsive interactions by interpreting the sign or direction of the force.
Determine qualitative and quantitative changes in electric potential energy.
Relate graphical area to physical work done during charge movement.
Understand energy transfer in electric fields without relying solely on algebraic forms.
By connecting graphical interpretation with the specification requirement that the area under a force–distance graph equals the work done, students gain a deeper appreciation of electric interactions in point and spherical charge systems.
Practice Questions
Question 1 (2 marks)
The graph below shows how the magnitude of the electric force between two point charges varies with separation.
Explain what the shaded area under the force–distance graph represents.
(2 marks)
Mark scheme:
• States that the area under the graph represents the work done in moving a charge between two distances. (1)
• Notes that this is because work is equal to force multiplied by distance (or the integral/area under F–r). (1)
Question 2 (5 marks)
Two isolated point charges, Q and q, are separated by a distance r. The electric force between them follows an inverse-square relationship.
(a) Explain how the shape of a force–distance graph for these charges reflects this relationship.
(b) Describe how you would determine the work done in moving charge q from distance r1 to a larger distance r2 using the force–distance graph.
(c) State how the sign (positive or negative) of the work done depends on the direction of the force relative to the direction of motion.
(5 marks)
Mark scheme:
(a)
• States that the force decreases rapidly with increasing distance. (1)
• Notes that the graph is a curve showing an inverse-square dependence (steep at small r, flattening at large r). (1)
(b)
• States that work done is found by calculating the area under the force–distance graph between r1 and r2. (1)
• Accepts mention of using integration or graphical area estimation. (1)
(c)
• States that work is positive when the motion is against the electric force, and negative when the motion is with the force. (1)
FAQ
A steeper graph indicates a larger force at a given separation, so the area under the graph increases more rapidly.
This means that even small changes in distance at short separations can contribute significantly to the total work done.
At larger separations, where the graph becomes flatter, additional distance contributes much less to the work.
Even when the force is very small, it is still non-zero, so movement through these regions contributes a small amount of work.
However, because the force decreases rapidly with distance, the additional area becomes negligible beyond a certain range.
This is why calculations often focus on distances where the force has significant magnitude.
Yes. A negative force on the graph indicates that the force acts in the opposite direction compared with a chosen positive direction.
Interpretation rules:
• Positive area corresponds to work done by an external agent.
• Negative area corresponds to work done by the field.
The sign convention depends entirely on how the axes and directions are defined.
The force varies as 1 divided by distance squared, producing a curved graph rather than a straight line.
Because the relationship is non-linear, the area cannot be found using simple geometric shapes.
Instead, integration is normally required to determine the exact work, although A-Level students only need to interpret the graphical meaning.
Changing the charge magnitude scales the graph vertically without changing the overall shape.
Insights include:
• A larger charge produces a proportionally larger force at every distance.
• The area under the curve increases, showing greater work is needed to move a charge through the same displacement.
This helps visualise how energy requirements depend on the strength of the interacting charges.
