
OCR Specification focus:
‘Use binding energy per nucleon versus nucleon number; compute binding energies from Δm and c².’
Binding energy curves reveal how nuclear stability varies with nucleon number, showing why energy is released in fission and fusion, while mass–energy calculations quantify these changes precisely.
Binding Energy and Nuclear Stability
The concept of binding energy is central to understanding why some nuclei are more stable than others. When nucleons combine to form a nucleus, a small amount of mass is lost and converted into energy. This energy, known as the binding energy, represents the energy required to separate the nucleus into its individual protons and neutrons.
Binding Energy: The energy released when a nucleus forms from free nucleons, or equivalently, the energy required to break the nucleus into its constituent nucleons.
This idea links directly to nuclear stability: a nucleus with a higher binding energy per nucleon is generally more stable. The binding energy curve is therefore a powerful graphical tool for explaining why certain nuclear processes release energy and others absorb it.
Mass Defect and the Energy–Mass Relationship
When a nucleus forms, its mass is slightly less than the total mass of the individual protons and neutrons that compose it. This difference is the mass defect, arising from the conversion of mass into binding energy according to Einstein’s relation.
Mass Defect: The difference between the mass of a nucleus and the total mass of its separate nucleons.
A brief gap between definition blocks ensures clarity. The quantitative link between mass defect and binding energy is given by one of the most important equations in nuclear physics.
EQUATION
—-----------------------------------------------------------------
Mass–Energy Relation (E) = Δm c²
Δm = Mass defect (kg)
c = Speed of light in vacuum (m s⁻¹)
E = Energy released or absorbed (J)
—-----------------------------------------------------------------
This relationship forms the basis for calculating binding energies from measured nuclear masses, a core requirement of the specification.
Binding Energy per Nucleon
To compare nuclei of different sizes, physicists use binding energy per nucleon, which indicates how tightly each nucleon is held within the nucleus. This value varies significantly across the periodic table. Lighter nuclei tend to have lower binding energies per nucleon, which increase with nucleon number up to a peak before gradually decreasing for heavy nuclei.
Key points:
Higher binding energy per nucleon → more stable nucleus.
A peak occurs around medium-mass nuclei such as iron-56, the most tightly bound of all.
Both nuclear fission (splitting heavy nuclei) and fusion (combining light nuclei) move products towards the peak, releasing energy.
Because binding energy calculations rely on the mass–energy relation, students must be confident in applying Δm c² to determine total binding energy and then dividing by nucleon number to obtain binding energy per nucleon.
The Binding Energy Curve
The binding energy curve plots average binding energy per nucleon against nucleon number.
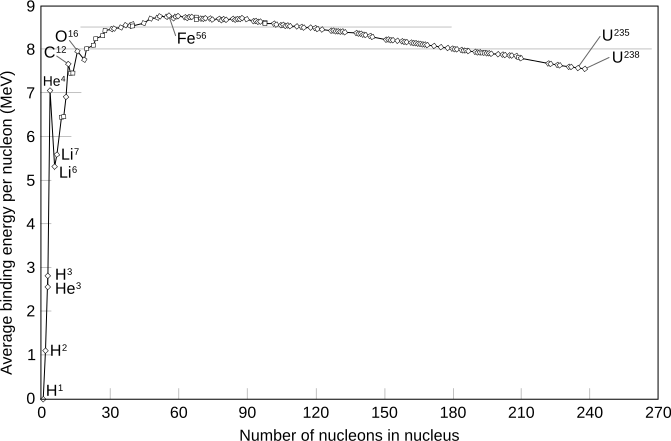
A labelled graph of average binding energy per nucleon versus nucleon number, showing the rise to the maximum near iron and the gradual decline for heavier nuclei. Extra isotope labels extend slightly beyond OCR requirements but support interpretation of the curve. Source.
Its distinctive shape conveys important information about nuclear processes and stability.
Key Features of the Curve
Rising region (A ≈ 1–20): Binding energy per nucleon increases sharply as nucleons combine into larger, more stable nuclei.
Peak region (A ≈ 50–60): Maximum stability occurs for nuclei such as iron and nickel.
Gradual decline (A > 60): Heavy nuclei become less stable due to increased proton–proton repulsion.
The curve encapsulates the physical reasons behind energy release in nuclear reactions.
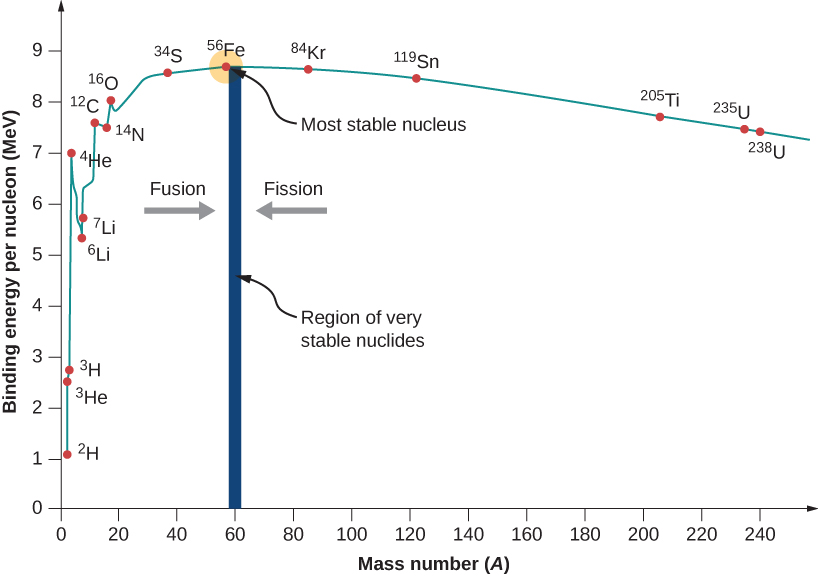
A binding energy per nucleon graph highlighting how fusion of light nuclei and fission of heavy nuclei move products toward the stability peak near iron, releasing energy in both cases. Source.
How to Interpret the Curve
Students should be able to relate positions on the curve to nuclear processes:
Fusion:
Light nuclei move to the right on the curve.
Binding energy per nucleon increases.
Energy is released.
Fission:
Heavy nuclei split and move leftwards.
Binding energy per nucleon increases.
Energy is released.
These trends arise because products of both processes lie closer to the curve’s maximum, meaning they are more stable than their reactants.
Calculating Binding Energies from Mass Data
The specification requires the ability to compute binding energies from Δm and c², which involves determining mass defect from atomic or nuclear masses and converting it to energy. Students should recognise the physical basis behind the process.
A typical calculation pathway involves:
Identifying the masses of the reactant nucleons.
Determining the actual nuclear mass.
Subtracting to obtain the mass defect (Δm).
Using Δm c² to find total binding energy.
Dividing by nucleon number to find binding energy per nucleon.
While full worked calculations are not included here, these steps form the foundation for quantitative analysis.
Relationship Between Binding Energy and Nuclear Reactions
Binding energy concepts directly explain why certain reactions power stars or nuclear reactors. The increased stability of products compared with reactants accounts for the energy output.
Important ideas:
Nuclear stability relates to strong nuclear force dynamics and electrostatic repulsion.
Energy released corresponds to an increase in binding energy per nucleon.
Both fission and fusion rely on moving nuclei towards the most stable region of the curve.
Understanding these principles allows students to connect microscopic nuclear behaviour to macroscopic energy release, fully aligning with the OCR specification requirements for this subsubtopic.
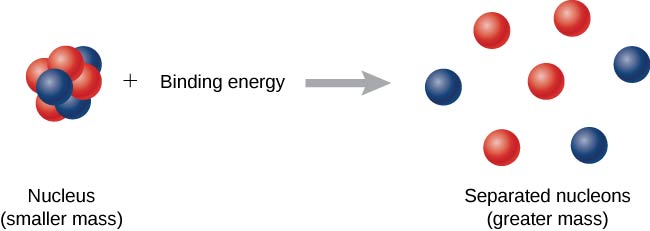
A diagram comparing a bound nucleus with its separated nucleons, showing that the mass difference (mass defect) corresponds to the binding energy through E = Δm c². Source.
Practice Questions
Question 1 (2 marks)
State what is meant by binding energy per nucleon and explain how it relates to nuclear stability.
Mark Scheme:
Binding energy per nucleon is the total binding energy of a nucleus divided by the number of nucleons. (1 mark)
A higher binding energy per nucleon indicates a more stable nucleus. (1 mark)
Question 2 (5 marks)
The binding energy per nucleon curve shows a peak around nucleon number 56.
(a) Explain why both nuclear fission of very heavy nuclei and nuclear fusion of very light nuclei release energy. (3 marks)
(b) Describe how the mass–energy relation E = Δm c² is used to calculate the binding energy of a nucleus from mass data. (2 marks)
Mark Scheme:
(a)
Fusion of light nuclei moves the products towards the peak of the curve where binding energy per nucleon is higher. (1 mark)
Fission of heavy nuclei also produces fragments closer to the peak with higher binding energy per nucleon. (1 mark)
Increased binding energy per nucleon means the products are more stable and the difference in energy is released. (1 mark)
(b)
Mass defect is calculated by subtracting the nuclear mass from the total mass of the separate nucleons. (1 mark)
This mass defect is substituted into E = Δm c² to obtain the total binding energy. (1 mark)
FAQ
The strong nuclear force becomes less effective at binding nucleons as nuclei grow larger because it acts only over very short ranges.
In heavier nuclei, proton–proton repulsion increases faster than additional neutrons can stabilise the nucleus, reducing the average binding energy per nucleon.
Iron-56 represents the best balance between strong-force attraction and electrostatic repulsion, giving it the highest average binding energy per nucleon.
Energy release depends on how far the reactants and products are vertically separated on the binding energy curve.
Reactions that produce nuclei with significantly higher binding energy per nucleon release more energy.
This means fusion of very light nuclei (far left) and fission of very heavy nuclei (far right) can release large amounts of energy because their products lie much closer to the curve’s peak.
The mass deficit indicates that energy was released when the nucleus formed, but binding energy is defined as the energy required to break the nucleus apart.
Because you must supply energy to separate the nucleons again, the binding energy is always a positive value.
Thus, although the nucleus has less mass, the binding energy represents stored stability, not a loss of usable energy.
Differences arise from subtle shifts in the balance between strong-force interactions and nucleon configuration.
Key contributors include:
• Neutron–proton ratios and how close they are to the most stable balance
• Pairing effects, where nuclei with even numbers of both neutrons and protons are more stable
• Shell effects, where certain nucleon numbers correspond to filled nuclear energy levels
These factors create small but measurable variations, even among isotopes with adjacent mass numbers.
Such nuclei sit well below the maximum binding energy per nucleon on the curve because their nucleon ratios deviate from the most stable configurations.
Excess neutrons or protons reduce the effectiveness of the strong nuclear force in binding the nucleus, lowering average binding energy.
These nuclei tend to undergo decay processes that move them toward configurations with higher binding energy per nucleon, increasing overall stability.
