
OCR Specification focus:
‘Use I = I₀ e^(−μx) with attenuation coefficient μ; interpret graphs and data.’
Understanding the X-ray Attenuation Equation
A wide range of diagnostic imaging techniques rely on predictable reductions in X-ray intensity as photons pass through matter, making the attenuation equation essential.
The Concept of X-ray Attenuation
When an X-ray beam travels through a material, its intensity decreases because photons are removed from the beam by absorption or scattering processes. Attenuation is therefore the progressive weakening of radiation due to interactions between photons and the atoms within a medium. This behaviour forms the basis for quantitative analysis in medical imaging, helping practitioners determine tissue properties, thicknesses, and contrasts in diagnostic images.
Attenuation: The reduction in intensity of an X-ray beam as it passes through a material due to absorption or scattering.
The relationship between the initial and final intensities is described using an exponential model. This model assumes that each thin layer of material removes a constant proportion of the incoming photons, meaning the rate of attenuation is proportional to the current intensity.
Mathematical Form of the Attenuation Law
The attenuation of X-rays is expressed using the exponential attenuation equation, which quantifies how photon intensity decreases with distance travelled through a uniform medium.
EQUATION
—-----------------------------------------------------------------
Attenuation Equation (I) = I₀ e^(−μx)
I = Transmitted intensity, measured in W m⁻²
I₀ = Initial intensity before entering the material, in W m⁻²
μ = Linear attenuation coefficient, in m⁻¹
x = Thickness of material travelled through, in m
—-----------------------------------------------------------------
This equation highlights how even small changes in thickness or composition of tissue can significantly alter the intensity detected after transmission.
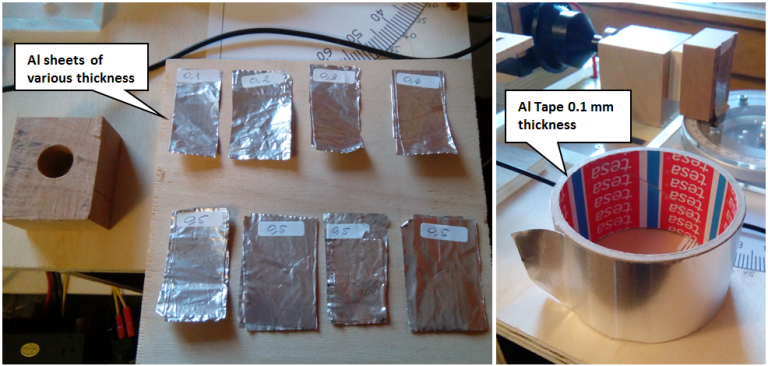
Layered aluminium tape forming different effective thicknesses used to demonstrate the dependence of transmitted intensity on absorber thickness. The specific experimental details exceed the OCR syllabus but provide realistic context for how x influences measured intensity. Source.
The exponential form also reflects the probabilistic nature of photon-matter interactions: each photon has a certain chance of interacting within a small region of material.
A practical understanding of this principle is crucial when interpreting radiographs. Denser or thicker regions of tissue result in greater attenuation and therefore appear lighter on an image because fewer photons reach the detector.
The Linear Attenuation Coefficient μ
The linear attenuation coefficient μ is a vital parameter describing how strongly a particular material attenuates X-rays. It depends on several factors, and students must appreciate its influence on imaging outcomes.
Linear Attenuation Coefficient (μ): A constant that describes the probability per unit distance that an X-ray photon will be attenuated in a specific material.
A short gap in the text before the next structured element allows students to process the meaning of μ in practical contexts. The value of μ varies considerably between tissues. Bone, with its high density and atomic number, possesses a large μ that causes strong attenuation. Soft tissues, which have lower atomic numbers and densities, have smaller μ values and therefore attenuate less.
Factors Affecting μ
Several key factors influence the value of μ for any given material:
Material density — Denser materials contain more atoms per unit volume, increasing the likelihood of photon interaction.
Atomic number (Z) — Higher atomic number results in stronger interactions, particularly via the photoelectric effect.
Photon energy — Higher energy photons are generally less likely to be attenuated, decreasing μ; however, different interaction mechanisms respond differently to energy changes.
Material composition — Mixtures or biological tissues exhibit effective attenuation coefficients reflecting their constituent elements.
These dependencies help explain contrast formation in medical images, where varying tissue compositions create different transmitted intensities.
Interpreting Graphs and Data Using the Attenuation Equation
Medical imaging often requires interpreting attenuation data presented in graphical or numerical form. Students must understand how the exponential equation shapes the appearance of such graphs. Typically, a graph of ln(I) against x yields a straight line with gradient −μ, enabling experimental determination of μ for a material.
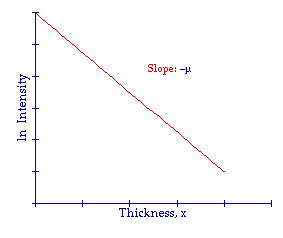
Graph showing how ln(I) decreases linearly with absorber thickness, illustrating that the gradient of this straight-line plot equals the attenuation coefficient −μ. Axis scaling and numerical values extend beyond the OCR syllabus but help visualise real attenuation data. Source.
Half-Value Thickness: The thickness of material required to reduce the X-ray intensity to half its initial value.
A normal explanatory sentence is necessary before presenting numerical relationships. The half-value thickness is related to μ by the expression x₁/₂ = ln(2)/μ, demonstrating how the attenuation coefficient directly governs how rapidly intensity falls. Materials with large μ values have small half-value thicknesses, indicating rapid attenuation.
Role of the Attenuation Equation in Medical Imaging
The attenuation equation is fundamental to radiographic practice. It allows prediction of how much an X-ray beam will weaken when passing through different tissues, which directly influences image contrast and patient dose considerations. Its applications include:
Optimising exposure settings to ensure diagnostic-quality images while minimising radiation dose.
Selecting appropriate materials for shielding, using known μ values to determine effective thicknesses.
Quantifying tissue thickness or density in computed tomography, where reconstructed data rely heavily on attenuation measurements.
Improving interpretation of radiographs, as regions with higher attenuation appear lighter owing to reduced photon detection.
Understanding these processes provides a strong conceptual foundation for further study of X-ray imaging techniques in the wider medical imaging topic.
Practice Questions
Question 1 (2 marks)
An X-ray beam of initial intensity I₀ passes through a material of thickness x. State the mathematical form of the attenuation equation and explain the meaning of the attenuation coefficient μ.
Question 1 (2 marks)
States the attenuation equation in the form I = I₀ e^(−μx). (1 mark)
Explains that μ is the linear attenuation coefficient, representing the probability per unit distance that a photon is removed from the beam. (1 mark)
Question 2 (5 marks)
A narrow, monoenergetic X-ray beam is directed through slabs of a material with different known thicknesses. A detector measures the transmitted intensity I for each thickness x.
(a) Explain why a graph of ln(I) against x is used to determine the attenuation coefficient μ.
(b) Describe how μ can be obtained from the graph, and comment on how experimental uncertainties might affect the accuracy of the result.
Question 2 (5 marks)
(a)
Notes that taking the natural logarithm of the attenuation equation gives ln(I) = ln(I₀) − μx. (1 mark)
Recognises this forms a straight-line relationship between ln(I) and x. (1 mark)
(b)
Identifies that μ is obtained from the gradient of the straight-line graph (gradient = −μ). (1 mark)
States that ln(I₀) is the y-intercept. (1 mark)
Mentions that uncertainties in intensity measurements, detector calibration, or thickness measurements affect scatter in the data and therefore the accuracy of μ. (1 mark)
FAQ
μ depends strongly on photon energy because different attenuation mechanisms dominate at different energies.
At low energies, the photoelectric effect is more likely, giving a larger μ.
At higher energies, Compton scattering becomes more significant, reducing μ.
For any material, μ typically decreases as photon energy increases, but the rate of decrease varies with atomic number.
The attenuation equation assumes a uniform material with constant density and composition.
In real materials, variations such as air pockets, impurities or structural differences cause local changes in μ.
These variations can lead to deviations from exponential behaviour, especially in thick or heterogeneous samples, making measured μ slightly inconsistent across different regions.
Reliable application requires:
• A monoenergetic X-ray beam
• Minimal scattering reaching the detector
• A narrow beam to reduce geometric broadening
• A uniform absorber with well-measured thickness
If these conditions are not maintained, detected intensity may include scattered photons or energy-dependent effects that distort the exponential relationship.
A narrow beam reduces the amount of scattered radiation reaching the detector.
Without this control, scattered photons artificially increase the measured intensity, making attenuation appear weaker and producing a lower apparent μ.
A narrow beam geometry ensures the detector mainly records unscattered photons, giving a more accurate exponential decrease.
Detector sensitivity affects how precisely changes in intensity are measured.
If sensitivity is low, small decreases in intensity for thin absorbers may be lost in noise, making μ appear less accurate.
Highly sensitive detectors provide:
• Better resolution of small intensity differences
• More reliable straight-line plots of ln(I) against x
• Reduced statistical variation in the calculated gradient
Thus, detector performance directly influences the precision of μ measurements.
