
OCR Specification focus:
‘Identify random and systematic errors in measurements, including zero errors on instruments.’
Understanding Measurement Errors
All measurements contain some degree of error — the difference between the measured value and the true value. Errors do not necessarily mean mistakes; they are often unavoidable consequences of the measuring process or the limitations of instruments. Recognising, analysing, and minimising these errors are essential skills for reliable experimental physics.
Systematic Errors
Systematic errors cause consistent deviations from the true value in the same direction every time a measurement is made. This means all readings are either too high or too low by a predictable amount. These errors affect the accuracy of measurements but not their precision.
Characteristics of Systematic Errors
They shift all results away from the true value by the same amount or proportion.
They cannot be reduced by repeating measurements.
They often result from faulty instruments, incorrect calibration, or experimental method flaws.
Common Sources
Instrumental errors:
Occur when an instrument gives false readings due to poor calibration or mechanical faults.
For example, a balance that reads 0.05 g even when empty exhibits a zero error.Environmental errors:
Caused by surrounding conditions such as temperature fluctuations, humidity, or air currents affecting sensitive instruments.Observational or human errors:
Happen when the observer consistently misreads a scale due to parallax or uses an incorrect measurement technique.
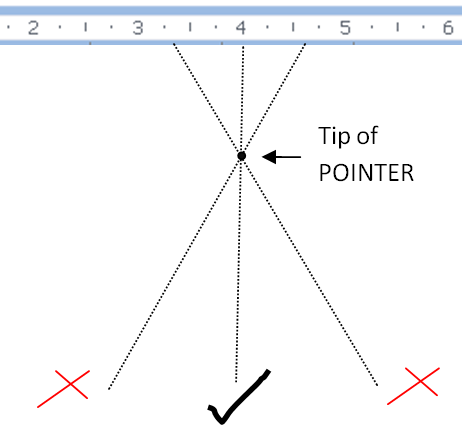
Diagram showing how viewing a pointer from above or below the normal line causes a parallax shift and a systematically high or low reading. Aligning the eye directly above the pointer eliminates the bias. Some instruments include a mirror behind the scale to aid alignment. Source.
Theoretical errors:
Arise from approximations or simplifications made in the experimental model, such as neglecting air resistance when calculating free-fall time.
Detecting and Correcting Systematic Errors
While systematic errors cannot be averaged out, they can often be identified and corrected through careful experimental design.
Methods for Minimisation
Calibration: Regularly check instruments against known standards.
Zero checks: Ensure devices read zero when no quantity is measured (e.g., ensure a voltmeter reads 0 V when disconnected).
Control experiments: Use reference measurements to test for consistent bias.
Instrument replacement or maintenance: Faulty equipment should be recalibrated or replaced.
Comparative measurements: Use different instruments or methods to cross-check results.
Random Errors
Random errors cause unpredictable variations in measurements due to uncontrollable factors that fluctuate from one reading to another. These errors affect the precision of data but not necessarily its accuracy.
Characteristics of Random Errors
They cause readings to scatter above and below the true value.
They result from uncontrollable variations in measurement conditions.
They can be reduced by taking multiple measurements and averaging the results.
Common Sources
Environmental fluctuations: Minor changes in temperature or air currents.
Observer judgement: Variation in human reaction times when using a stopwatch or reading a scale.
Instrument sensitivity: Slight inconsistencies in instrument response.
Sample variation: Natural variability in experimental materials.
Reducing Random Errors
Because random errors are inherently unpredictable, the goal is to minimise their impact on data reliability rather than eliminate them entirely.
Techniques for Reduction
Repeat measurements: Taking multiple readings reduces the effect of anomalies when calculating an average.
Use of precise instruments: Instruments with finer scales reduce uncertainty.
Consistent methodology: Keep conditions constant and apply uniform measurement techniques.
Statistical analysis: Calculate the mean, range, and standard deviation to assess data spread.
Distinguishing Between Systematic and Random Errors
Understanding how these two error types differ is essential for analysing experimental data.
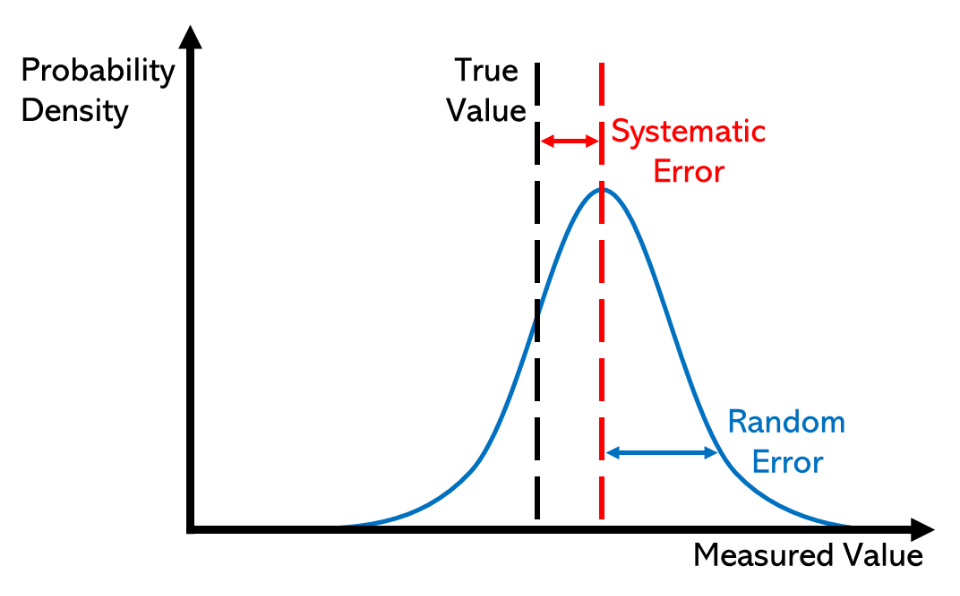
A labelled distribution contrasts systematic error (a consistent shift from the true value) with random error (spread about the mean). The red curve shows the biased mean; the blue curve shows the random dispersion. Use this to link accuracy with bias and precision with spread. Source.
Comparison Overview
Direction of deviation: Systematic errors shift results in one direction; random errors scatter results in both.
Impact: Systematic errors influence accuracy, random errors influence precision.
Correction: Systematic errors can be corrected through calibration; random errors are mitigated through repetition.
Detection: Systematic errors may show up when results disagree with accepted values; random errors appear as data scatter.
Zero Errors and Instrument Calibration
A specific type of systematic error, zero error, occurs when an instrument does not read zero when it should.
Examples include:
A voltmeter showing a small non-zero reading when disconnected.
A micrometer screw gauge showing an offset when fully closed.
Zero Error: A type of systematic error where a measuring instrument gives a non-zero reading when the quantity measured should be zero.
Zero errors can be corrected either by adjusting the instrument before taking readings or by subtracting/adding the known offset value from all measurements.
Accuracy, Precision, and Reliability
Although accuracy and precision are covered separately in the next subsubtopic, it is vital to understand how errors relate to these terms here.
Accuracy: The closeness of a measured value to the true or accepted value.
Precision: The degree of agreement among repeated measurements of the same quantity.
Systematic errors reduce accuracy, while random errors reduce precision. Minimising both enhances the reliability of results.
Strategies for Error Evaluation in Experiments
When analysing data in A-Level Physics practicals, students must show awareness of both random and systematic errors.
Recommended Practices
Always state potential sources of error in written reports.
When comparing data to theoretical predictions, discuss how systematic errors could explain discrepancies.
Use error bars on graphs to show uncertainty caused by random errors.
Indicate instrument resolution to justify the smallest measurable unit.
Identify whether differences between experimental and expected results are due to bias (systematic) or scatter (random).
Summary of Key Points for Experimental Work
Systematic errors affect accuracy; they are constant and directional.
Random errors affect precision; they are variable and unpredictable.
Zero error is a key form of systematic error, often present in instruments.
Minimisation techniques include calibration, repetition, environmental control, and correct data analysis.
Recognising error types enables meaningful comparison between experimental and theoretical results, a vital skill in advanced physics.
Practice Questions
Question 1 (2 marks)
A student measures the length of a metal rod several times using a metre rule. Each measurement is about 0.3 cm greater than the true value.
(a) Identify the type of error present in these measurements.
(b) State one likely cause of this error.
Mark Scheme – Question 1
(a) Systematic error – 1 mark
(b) Zero error or miscalibrated scale (e.g. the ruler does not start exactly at 0 or has been incorrectly positioned) – 1 mark
Question 2 (5 marks)
A student is investigating the relationship between the extension of a spring and the applied force. The following observations are made:
The measurements of extension vary slightly when the same force is applied.
The plotted data points lie close to, but not exactly on, a straight line through the origin.
The calculated spring constant is higher than the accepted value.
(a) Identify which observations indicate random errors and which indicate systematic errors.
(b) Explain how the student could reduce each type of error.
(c) Describe one experimental check the student could perform to detect a systematic error.
Mark Scheme – Question 2
(a)
Random errors: Variation in extension measurements for the same force – 1 mark
Systematic errors: Calculated spring constant higher than accepted value (suggests constant bias in readings) – 1 mark
(b)
To reduce random errors: Take repeated readings and calculate a mean to minimise the effect of unpredictable variations – 1 mark
To reduce systematic errors: Check and calibrate instruments (e.g. ensure the spring scale or ruler has no zero error) – 1 mark
(c)
Perform a control or calibration check by measuring a known standard (e.g. a known weight or spring constant) or by plotting the line of best fit and verifying whether it passes through the origin – 1 mark
FAQ
A zero error occurs when an instrument does not read zero when the true value of the measured quantity is zero, such as a balance showing a reading when empty.
An offset error is a broader term that includes any consistent bias added to readings, regardless of whether it originates at zero.
All zero errors are offset errors, but not all offset errors occur at zero.
Both are types of systematic error, as they shift all measurements by a constant amount.
Yes. Most experiments experience both simultaneously.
Systematic errors bias all results in one direction, affecting accuracy.
Random errors cause scatter in the data, affecting precision.
For example, if a thermometer is incorrectly calibrated (systematic error) and temperature readings fluctuate slightly due to air movement (random error), both error types affect the final data set.
Repeating measurements reduces random errors but not systematic ones.
Repeating measurements allows statistical analysis to reveal data spread caused by random fluctuations.
A large spread (wide range or high standard deviation) suggests significant random error.
A small spread indicates more consistent readings and better precision.
By comparing repeated values, students can identify whether variation arises from random influences such as environmental changes or human judgement rather than a constant bias.
Calibration compares an instrument’s readings to a known standard and adjusts for consistent bias, removing systematic error.
However, random errors result from unpredictable fluctuations — for example, changes in environmental conditions or user reaction time.
Since calibration cannot remove unpredictable variation, random errors must instead be reduced by repetition and statistical averaging.
Graphs can visually reveal the presence and type of error:
Systematic error: The line of best fit does not pass through the origin or has an incorrect slope, suggesting a consistent bias.
Random error: Data points are scattered around the best-fit line but show no consistent pattern of deviation.
Including error bars on data points helps visualise uncertainty and compare the magnitude of random variation between readings.
