
OCR Specification focus:
‘Define impulse Δp = FΔt; determine impulse from the area under a force–time graph.’
Impulse connects force and momentum, showing how a force acting over time changes an object’s motion. Understanding impulse and force–time graphs reveals how real forces influence moving bodies.
Impulse and Change in Momentum
When a force acts on a body for a finite period, it causes a change in the body’s momentum. This change is described through the concept of impulse, which directly links force, time, and momentum.
Impulse: The product of a constant force and the time interval over which it acts; equal to the change in momentum of an object.
EQUATION
—-----------------------------------------------------------------
Impulse (Δp) = Force (F) × Time (Δt)
Δp = change in momentum (kg m s⁻¹)
F = force (N)
Δt = time interval (s)
—-----------------------------------------------------------------
Impulse is therefore a vector quantity, since it depends on the direction of the applied force and the resulting change in velocity. A force acting to the left produces an impulse in the same direction, which must be considered when analysing systems.
In practical terms, impulse measures how strongly and for how long a force acts to change an object’s motion. A large impulse can result from either a large force acting briefly or a smaller force acting over a longer period.
Relationship Between Impulse and Momentum
The connection between impulse and momentum follows from Newton’s Second Law, which states that the net force on an object equals the rate of change of its momentum. Integrating this relationship over time gives the total impulse delivered to the object.
EQUATION
—-----------------------------------------------------------------
Net force (F) = rate of change of momentum = Δp / Δt
Rearranging gives Δp = FΔt
—-----------------------------------------------------------------
Thus, impulse quantifies the total effect of a force on an object over a given duration. When the net force is zero, there is no impulse and therefore no change in momentum.
In real scenarios such as collisions, contact times are often short, and forces are very large and rapidly changing. This makes it essential to consider the force–time variation to calculate impulse accurately.
Force–Time Graphs
A force–time graph displays how the force acting on an object changes during a specific event, such as a collision, push, or impact. The graph’s horizontal axis represents time, while the vertical axis represents force.
The area under the force–time graph corresponds to the impulse delivered to the object, and therefore to the change in momentum.
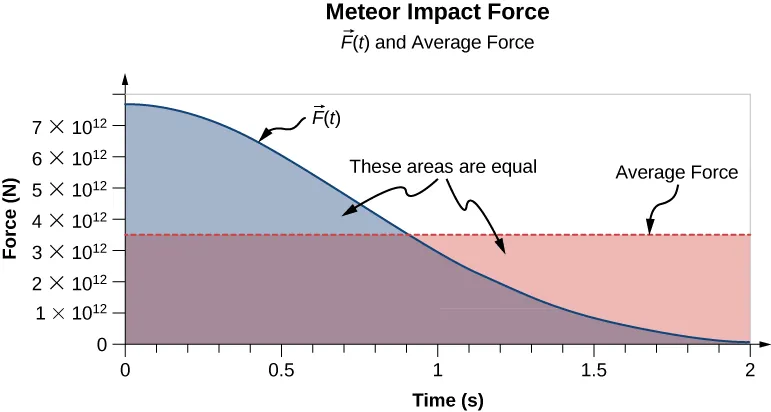
A force–time graph showing a varying F(t) and an equivalent average-force rectangle with equal shaded areas. The equal areas represent equal impulse (Δp), visualising impulse as the area under the curve. Source
Force–time graph: A graphical representation showing how the force acting on an object varies with time; the area under the graph gives the impulse.
This method is especially valuable when the force is not constant.
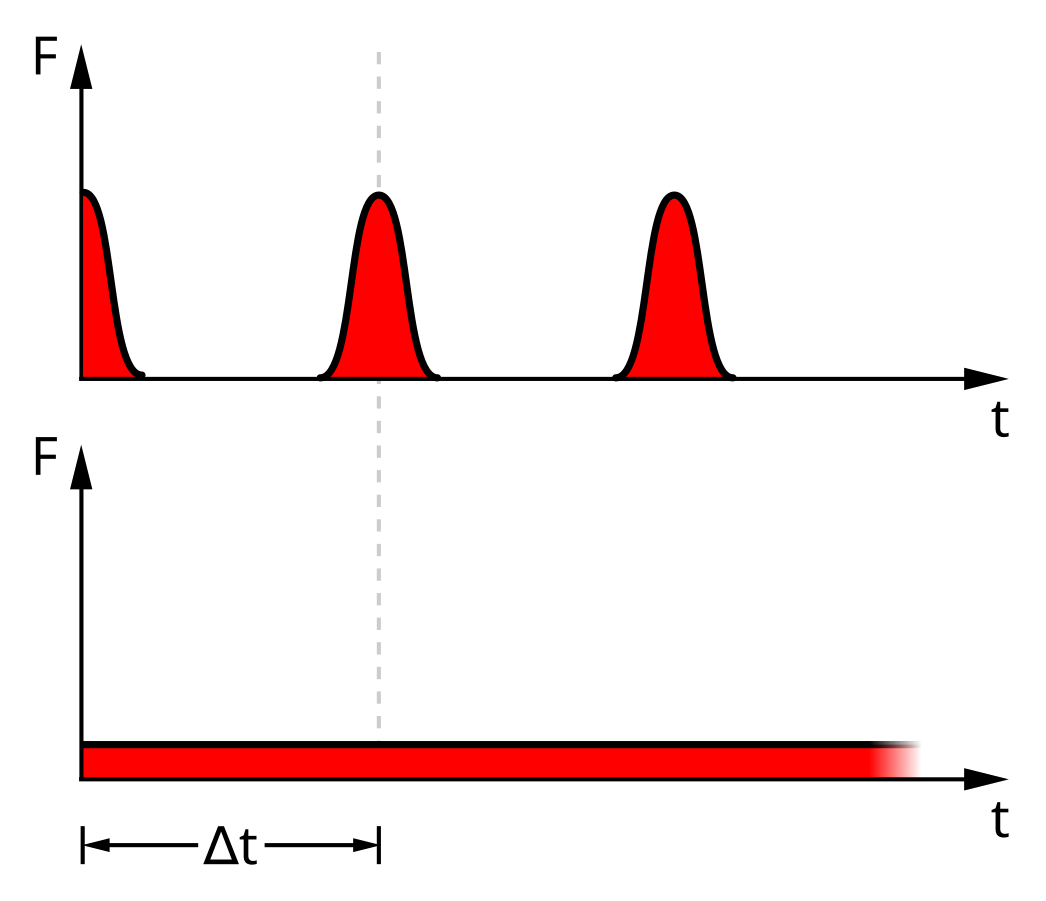
A labelled force–time plot comparing a time-varying force and a constant average force; the shaded areas are equal, so the impulses are equal. Although the example refers to a meteor impact, the physics is general and directly applies to any impulse event. Source
In these cases, the impulse cannot be found simply using FΔtFΔtFΔt; instead, it is determined from the integral of the force over time, corresponding to the total shaded area beneath the graph.
Determining Impulse from a Force–Time Graph
To determine impulse from a force–time graph:
Identify the time interval during which the force acts.
Measure or calculate the area under the graph within that interval.
The numerical value of this area equals the magnitude of the impulse.
The direction of the impulse is the same as the direction of the applied force.
If the force varies with time, the total impulse can be found by summing small contributions where the force can be approximated as constant, or by using integration techniques in more advanced treatments.
When the force changes direction, the area above the time axis represents a positive impulse, while the area below represents a negative impulse. The net impulse is the algebraic sum of these areas, determining the overall change in momentum.
Interpretation of Force–Time Graph Shapes
Different graph shapes correspond to different physical situations:
Rectangular shape – represents a constant force acting over a fixed time (e.g., a steady push).
Triangular or trapezoidal shape – represents a force that increases and decreases smoothly, typical of collisions or impacts.
Irregular curve – represents varying forces such as air resistance or non-uniform contact forces.
In each case, the impulse equals the total area beneath the curve between the start and end of the force application.
Applications of Impulse
Impulse has widespread applications in understanding and designing systems where forces act over short time periods.
Safety and Engineering
Car safety systems such as airbags and crumple zones increase the time of impact during collisions, reducing the average force for the same impulse.
Helmets and padding work similarly, spreading the impact over a longer duration to reduce injury risk.
Sports equipment such as cricket bats or tennis rackets are engineered to manage impulse transfer effectively for control and safety.
In each of these examples, the principle remains consistent: for a given change in momentum, increasing the contact time reduces the average force experienced.

A deployed airbag increases the collision time, thereby reducing the average force on occupants for the same impulse. This image links the abstract impulse–time relationship to a practical safety device. Source
Everyday and Natural Contexts
Impulse is also present in natural phenomena and everyday motion:
A basketball bouncing involves a short, high force that reverses momentum direction.
A rocket engine provides a continuous impulse by expelling gases backward, propelling the rocket forward.
When a person jumps, their feet exert a downward impulse on the ground, and the ground provides an equal and opposite impulse upwards.
These situations emphasise that impulse is not only a theoretical construct but a practical measure of how motion changes through forces acting over time.
Average and Variable Force
In many events, the force acting is not constant. It is often useful to calculate an average force that produces the same impulse over the same time period.
EQUATION
—-----------------------------------------------------------------
Average force (Fₐᵥ) = Impulse (Δp) / Time (Δt)
—-----------------------------------------------------------------
This allows comparison between systems or simplification of complex data. The average force gives a convenient measure even when the actual force fluctuates widely.
Direction and Vector Nature of Impulse
Because both force and momentum are vector quantities, impulse must also be treated as a vector. When analysing motion in two or three dimensions, components of impulse must be resolved along perpendicular axes, ensuring correct directional relationships between applied forces and resulting changes in motion.
Understanding this vector nature is crucial when dealing with multi-dimensional impacts, rebounds, or motion in fields such as sports physics and engineering dynamics.
Practice Questions
Question 1 (2 marks)
A tennis ball experiences an average force of 25 N for 0.080 s when struck by a racket.
Calculate the impulse delivered to the ball and state the change in momentum of the ball.
Mark scheme:
Correct use of equation impulse = F × Δt (1 mark)
Correct substitution and answer: 25 × 0.080 = 2.0 N s (or kg m s⁻¹) (1 mark
Question 2 (5 marks)
The graph below shows how the force acting on a car during a collision varies with time.
The car comes to rest during the collision. The shaded area under the graph represents the impulse delivered to the car.
(a) Explain what is meant by impulse and how it relates to the change in momentum of the car. (2 marks)
(b) The driver’s airbag increases the time taken for the driver’s head to come to rest during impact.
Use the concept of impulse to explain how the airbag reduces the force on the driver. (3 marks)
Mark scheme:
(a)
States that impulse is the product of force and time or area under a force–time graph (1 mark)
States that impulse equals the change in momentum (Δp) (1 mark)
(b)
States that for a given change in momentum, impulse remains constant (1 mark)
Increasing the impact time reduces the average force (1 mark)
Explains that the airbag therefore reduces injury by lowering the force on the driver’s head (1 mark)
FAQ
Impulse relates to the change in momentum, but it can also be linked to energy changes. When a force acts over a time interval, it not only alters the object’s momentum but may also change its kinetic energy depending on the direction of the force and motion.
If the force acts in the same direction as the motion, kinetic energy increases.
If the force opposes motion, kinetic energy decreases.
However, impulse alone does not quantify energy transfer — it only describes momentum change.
During collisions or impacts, forces can change extremely quickly and are difficult to measure directly. Using impulse simplifies analysis because it accounts for the total effect of the force over time rather than the exact value of the force at every moment.
By measuring or estimating the area under a force–time graph, physicists can calculate the impulse — and hence the momentum change — even if the instantaneous force is highly variable or unknown.
When catching a fast-moving ball, players instinctively move their hands backwards upon impact. This increases the time duration (Δt) during which the force acts.
Since the impulse (Δp) must equal the ball’s change in momentum, extending Δt reduces the average force on the hand.
The same principle is applied in cricket, baseball, and goalkeeping — cushioning or giving with the ball spreads the impulse over a longer time, reducing impact force.
This technique relies entirely on the impulse–momentum relationship.
Yes — if the object has a large mass. The same impulse causes a smaller change in velocity for a larger mass because Δp = mΔv.
For example, a heavy lorry and a small car might both receive an impulse of 2000 N s. The car’s velocity changes significantly, but the lorry’s change in velocity is minimal because its mass is much greater.
This illustrates how impulse depends on both the force–time product and the object’s mass.
An impulse opposite to the direction of motion results in a reduction of momentum, slowing the object down.
If the impulse is large enough to make the momentum zero, the object stops. A larger opposing impulse can even reverse the direction of motion, such as when a ball bounces back after hitting a wall.
In these cases, the direction of the impulse vector determines the new direction of motion after the interaction.
