
AP Syllabus focus: 'The concept of calculating areas in rectangular coordinates can be extended to polar coordinates.'
Polar area extends familiar definite-integral area ideas to curves described by radius and angle. Instead of adding thin rectangles, we approximate a region with many narrow sectors and add their areas.
Why Polar Area Needs Its Own Formula
In rectangular coordinates, area is often built from vertical or horizontal strips. Each strip has a simple shape, so its area is approximated by multiplying height by width. In polar coordinates, however, a point is located by its distance from the origin and its angle from the polar axis. Because the geometry is different, the natural “small pieces” of area are not rectangles.
When a polar curve is written as , changing slightly sweeps out a narrow sector-like region.
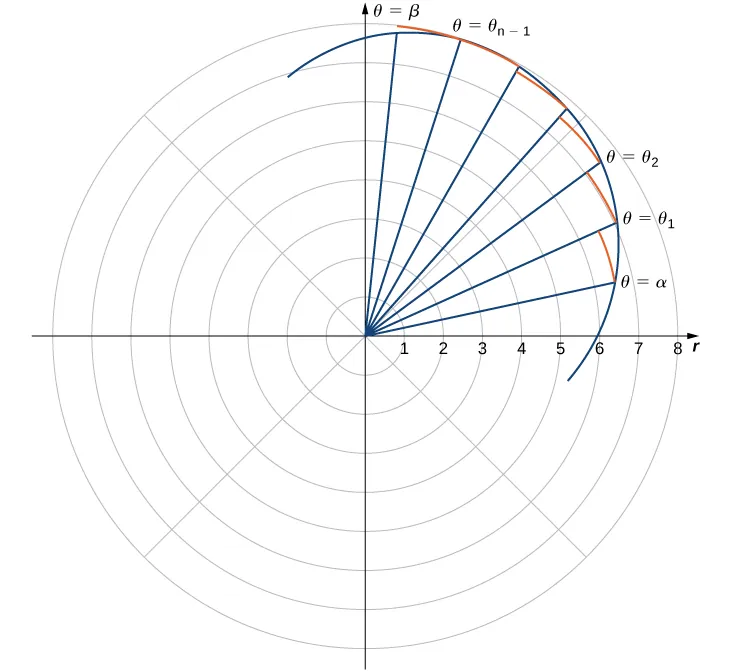
A polar region can be approximated by partitioning the angle interval from to into many small subintervals and forming thin sectors. Each sector’s radius is approximately over a small , so adding sector areas leads naturally to an integral in . Source
That makes angle the natural variable of integration. The definite integral for polar area comes from summing many tiny sectors in the same way rectangular area comes from summing many tiny rectangles.
Polar region: A region in the plane described by a polar equation over an interval of angles, with points located by a radius and an angle .
This viewpoint is essential: in polar problems, area is accumulated as the angle changes, not as or changes.
Building the Formula
From sectors to a definite integral
For a circle of radius , the area of a sector with central angle in radians is approximately .
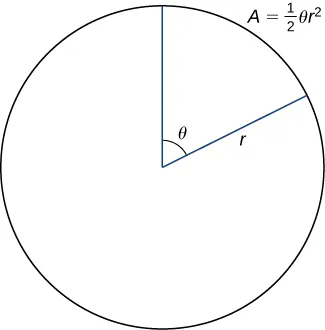
This figure isolates a single circular sector with radius and central angle (in radians), whose area is . Replacing by a tiny angle increment is what produces the polar-area building block . Source
If the radius is not constant but depends on the angle, then on a very small interval of angles the radius is nearly constant, so the small piece of area is approximately .
Adding these small pieces over an interval from to gives a Riemann sum. Taking the limit produces the polar area formula.
= area of the region, square units
= radius of the curve at angle
= angle interval that sweeps out the region, radians
This formula gives the area of the region swept out by the curve as moves from to , provided that interval describes the desired region appropriately.
Interpreting the Formula
The most important idea is that the formula does not automatically mean the entire area inside a polar curve. It gives the area traced over a specific interval of angles. On an AP Calculus BC problem, you must first identify which interval of produces the region once and only once.
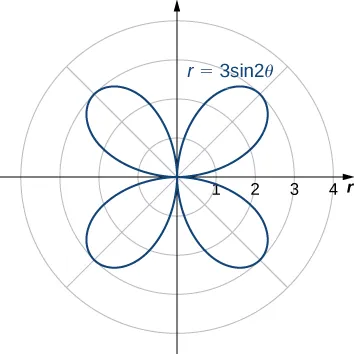
The rose curve has four identical petals, and each petal is traced over its own specific -interval. A correct area computation typically integrates over the interval that traces one petal exactly once, then uses symmetry if needed to scale to the full figure. Source
If the curve crosses the pole, changes direction, or retraces part of the graph, one integral may not describe the whole region correctly. In those cases, the region may need to be represented by more than one interval. The formula itself stays the same, but the setup must match the geometry of the graph.
Why the radius is squared
The square on comes from sector geometry. A sector with twice the radius does not have twice the area; it has four times the area. This is consistent with the familiar circle formula .
The square also means each tiny contribution to area is nonnegative. That is why polar area uses rather than just . Even so, the graph can still behave unexpectedly if negative values of occur, so the angle interval must still be chosen with care.
Choosing the Angle Interval
The bounds of integration are angles, not -values or -values. They are usually found from the description of the region, from the graph, from symmetry, or from values where the curve begins or ends tracing a piece.
A common mistake is to use automatically. That interval is only correct if it traces the intended region exactly once. Some polar curves repeat themselves before reaching , and some regions are only a symmetric portion of the graph. In those situations, integrating over the smallest useful interval and then using symmetry can be more efficient.
Angles should be measured in radians, since the sector-area reasoning behind the formula depends on radian measure.
Connection to Riemann Sums
The polar area formula is a genuine calculus result, not a memorized shortcut. If the interval is divided into many small pieces of width , and a sample angle is chosen from each piece, then the area is approximated by
.
As the number of pieces increases and approaches , that sum approaches the definite integral. This is the same conceptual foundation used for area in rectangular coordinates, but adapted to the natural geometry of polar graphs.
Conditions and Common Errors
In most AP settings, the formula is used when is continuous on the interval being considered. If the graph is best described in separate pieces, then the area should also be found in separate integrals and combined.
Common errors include:
forgetting the factor
integrating instead of
using incorrect angle bounds
using degrees instead of radians
integrating over an interval that traces the same region more than once
assuming the graph’s full visible shape is always represented by a single integral
Practice Questions
The curve is given for . Write, but do not evaluate, a definite integral for the area of the region swept out by the curve on this interval. [2 marks]
Uses the polar area formula with the factor and squares the radius: 1 mark
Uses the correct bounds and : 1 mark
Accept:
A region is swept out by the polar curve for .
(a) Write a definite integral for the area of the region. [1 mark]
(b) Find the exact area of the region. [4 marks]
(a) Correct setup: : 1 mark
(b) Expands the integrand correctly, for example : 1 mark
Uses a valid identity such as : 1 mark
Integrates correctly to obtain the exact value: 1 mark
Final answer : 1 mark
FAQ
The sector formula behind polar area is based on radian measure. For a sector, the area is $\dfrac{1}{2}r^2\theta$ only when $\theta$ is measured in radians.
If degrees were used, an extra conversion factor would be needed. In calculus, the standard integral formula assumes radians automatically, so using degrees will give an incorrect area unless you adjust for the unit change.
It is safe when the graph and the region are genuinely symmetric and your chosen interval traces exactly one repeated piece.
A good check is:
identify the line or axis of symmetry
verify that the repeated parts are congruent
make sure your smaller interval does not already retrace a piece
If any of those fail, symmetry can produce overcounting or undercounting.
Zeros of $r$ often mark the start or end of a distinct piece of the graph, especially near the pole. They are useful places to test whether the tracing changes.
You should consider splitting when:
the curve passes through the pole
the graph forms separate loops or petals
the region description changes at that angle
A sketch usually makes this decision much clearer.
Yes. Polar graphs are sensitive to window settings, tracing step size, and graphing mode. A calculator may miss thin loops, display rough edges, or connect points in a misleading way.
If the picture seems suspicious:
check that the calculator is in polar mode
reduce the graphing step size if possible
compare the visual graph with key angles and values of $r$
Technology helps, but it should not replace geometric reasoning.
Yes. A region may be described by different angle intervals, especially on periodic or symmetric curves.
For instance, one setup might integrate over a full interval directly, while another integrates over half the region and doubles the result. Both are valid if they cover exactly the same area once overall.
What matters is not the appearance of the integral, but whether the interval choice matches the geometry of the region.
