
AP Syllabus focus:
‘Introduction to variables as characteristics that vary from one individual to another. Understanding that variation in data may be random or systematic, affecting the certainty of conclusions drawn. Learning how to identify different variables in a dataset, recognizing that each variable represents a specific characteristic that can change across observations. Skill 2.A: Developing the ability to identify variables within a given set of data accurately.’
Identifying variables is an essential first step in understanding how data behave, allowing statisticians to interpret information, recognize variation, and make reasoned analytical decisions.
Understanding Variables in Data
In statistics, a variable refers to any characteristic that can take on different values across individuals or items in a dataset. Identifying variables correctly is fundamental because it determines how data can be interpreted, represented, and analyzed. This aligns directly with the syllabus emphasis that variables represent characteristics subject to change and may exhibit random or systematic variation, both of which influence the certainty of conclusions.
Variable: A characteristic or attribute that can vary from one individual, object, or observation to another.
Variation is central to statistical thinking. The concept that data values differ—sometimes unpredictably and other times with a detectable pattern—underpins all statistical inference. Because variables capture these differing characteristics, identifying them precisely allows analysts to determine what story the data may tell.
Recognizing Variation in Variables
All variables exhibit variation, meaning the values they take are not identical across observations. The syllabus distinguishes between two major forms of variation: random variation and systematic variation.
Random Variation: Natural, unpredictable differences among data values that occur without a consistent pattern.
Random variation limits certainty in conclusions because it reflects chance differences that cannot be attributed to any specific factor. It is an unavoidable aspect of real-world data.
Systematic Variation: Differences in data values that follow an identifiable pattern or result from a known influence or factor.
Systematic variation suggests that a meaningful relationship or structure exists in the data. Identifying variables enables analysts to distinguish between these forms, helping determine whether observed differences have meaningful explanations.
Importance of Identifying Variables
Skill 2.A underscores accurate identification of variables. This process supports clear interpretation of data context, appropriate selection of statistical methods, and valid communication of findings. Recognizing variables ensures analysts understand what is being measured and how those measurements relate to the broader research question.
Several key reasons make variable identification essential:
It clarifies what characteristic is being studied.
It reveals whether the data involve categories, numerical measurements, or another form of information.
It supports proper choice of graphs or summary statistics.
It enables detection of patterns, trends, or anomalies within the dataset.
It helps determine whether variation is random or systematic, affecting the strength of any conclusions.
Properly identifying variables ensures that data are interpreted within their correct context, which the syllabus emphasizes as foundational to meaningful analysis.
How to Identify Variables in a Dataset
Identifying variables involves careful attention to the structure and meaning of the data. When students encounter a dataset for the first time, they should examine what each column or attribute represents and determine whether it reflects a characteristic that varies across observations.
A systematic approach includes:
Step 1: Determine the Observational Units
Observational units are the individuals, objects, or cases being described. Variables must always relate to these units.
Observational Unit: The individual or entity about which data are collected and for which variables are measured.
Once the observational unit is established, the role of each variable becomes clearer.
Step 2: Identify What Characteristic Is Being Measured
Each column or label in a dataset corresponds to a characteristic of the observational unit.
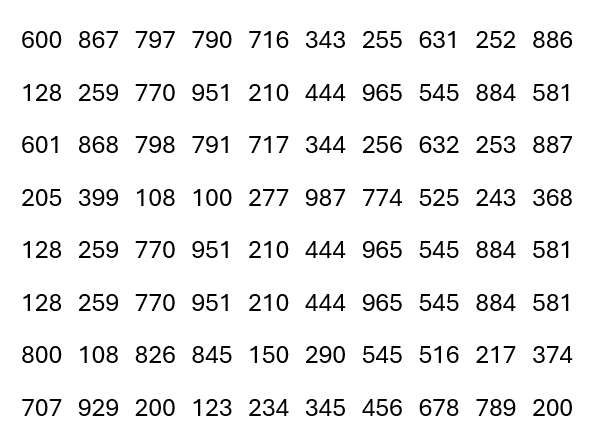
A small dataset of three-digit numbers arranged in rows and columns. Each column can be interpreted as a separate variable, while each row represents an observational unit. This highlights the typical structure of datasets used to identify variables. Source.
If the values differ across units, that characteristic is a variable.
Step 3: Check Whether the Values Vary
For an attribute to be considered a variable, the values must not all be identical. Absence of variation means there is no meaningful information to analyze.
Step 4: Consider the Role of Variation
Since the syllabus emphasizes that variation may be random or systematic, identifying the variable allows analysts to decide whether differences in values reveal meaningful patterns or simply reflect chance.
Step 5: Use Context to Interpret Each Variable
Context connects variable values to real-world meaning. Without context, variable identification becomes mechanical rather than analytical.
Understanding How Variables Affect Certainty of Conclusions
Because variables inherently vary, conclusions drawn from them carry uncertainty. This uncertainty arises from:
Random variation, which limits predictability.
Measurement limitations, influencing how precisely variables capture information.
Sample differences, as data values may differ from one group to another.
Understanding these influences helps students appreciate why statistical conclusions are probabilistic rather than absolute.
Systematic variation suggests that a meaningful relationship or structure exists in the data.
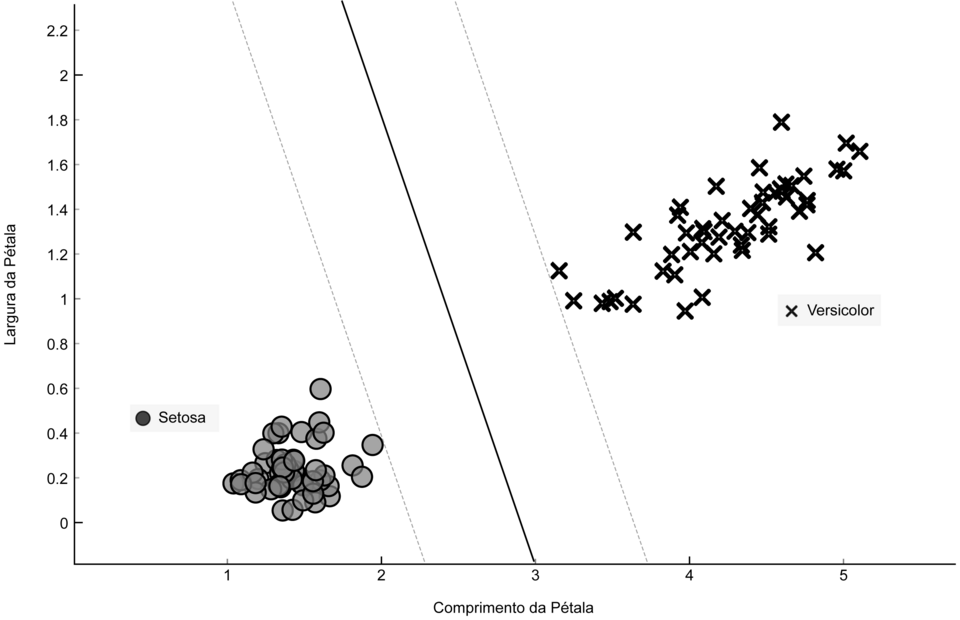
Scatterplot of the Iris dataset showing flowers plotted by petal length and petal width, each axis representing a quantitative variable. The point cloud illustrates how values vary across individual observations, revealing structured patterns. The SVM boundary is extra detail not required for this subsubtopic. Source.
Accurately identifying variables in data forms the foundation of all subsequent statistical analysis. It allows students to understand variation, interpret context, and apply appropriate methods, fulfilling the expectations of the AP Statistics syllabus for this subsubtopic.
FAQ
A characteristic counts as a variable as long as its value is not identical for all observations, even if the differences are very small.
Small variation still provides information because it shows the measurement is not fixed. In Physics, slight differences often arise from manufacturing tolerances or measurement precision.
To decide, check:
• Does the value change across observations?
• Is the change due to the property itself or only due to instrument resolution?
If the value genuinely differs between objects or events, it is a variable.
Context tells you what is being measured, why it is being measured, and how the value relates to the physical system.
Without context, a column of numbers could represent anything — mass, time, voltage, or displacement — making interpretation impossible.
Context also determines:
• Whether variation is expected
• Whether the variable should remain controlled
• Whether a variable affects the outcome of interest
Not necessarily. A quantity is only a variable if it changes across the observational units or repeated measurements.
A measured quantity held constant — such as fixed voltage or constant temperature — is a controlled quantity rather than a variable.
A quantity that is the same for all observations adds no variation and therefore cannot be analysed as a variable.
Consider whether the variation reflects a physical difference or simply measurement limitations.
Ask:
• Do repeated measurements under identical conditions give different values?
• Does increasing instrument precision reduce the variation?
• Can the variation be linked to a physical factor?
If variation disappears with better technique or calibration, it is likely an artefact. If it persists, it may reflect a true variable.
Observational units determine the scale and meaning of each variable.
For example, if the units are individual components, variables describe their physical properties. If the units are repeated trials, variables describe each trial’s conditions or outcomes.
Correctly identifying the observational units ensures that:
• Each variable is tied to the right physical entity
• Data are interpreted at the appropriate level
• Patterns in variation are attributed to the correct source
Practice Questions
Question 1 (2 marks)
A researcher records the mass of 50 identical metal cubes and finds that the values vary slightly from cube to cube.
(a) Identify the variable being measured.
(b) State whether the variation in the measurements is most likely to be random or systematic, giving a brief reason.
Question 1
(a) Mass of the metal cubes. (1 mark)
(b) Random variation, because the small differences are likely due to measurement uncertainty or natural manufacturing differences rather than a consistent bias. (1 mark)
Question 2 (5 marks)
A physics field study collects data on wind turbines. For each turbine, students record blade length, rotational speed, and the number of rotations completed in one minute.
(a) Identify the observational units and the variables in this investigation.
(b) Explain how you would determine whether the variation in rotational speed is random or systematic.
(c) Discuss why correctly identifying variables is essential when analysing and interpreting this dataset.
Question 2
(a)
• Observational units: the wind turbines. (1 mark)
• Variables: blade length, rotational speed, number of rotations per minute. (1 mark)
(b)
• State that systematic variation would show a consistent pattern or trend (e.g., associated with blade length or turbine model). (1 mark)
• State that random variation would show unpredictable scatter with no clear pattern. (1 mark)
• Explanation that comparing rotational speed against other recorded variables or repeating measurements can help distinguish between random and systematic effects. (1 mark)
(c)
• Identifying variables ensures correct interpretation of what is being measured. (1 mark)
• Allows appropriate choice of analysis method (e.g., graphs or summary statistics). (1 mark)
• Ensures valid conclusions about relationships or differences between turbines. (1 mark)
