
AP Syllabus focus:
‘Distinguishing between discrete and continuous quantitative variables.
Understanding discrete variables as having countable values, whether finite or countably infinite (like counting numbers).
Recognizing continuous variables as capable of taking infinitely many values, with values that cannot be counted due to the infinitesimal difference between them.
Skill 2.A: Developing the ability to classify quantitative variables accurately based on their characteristics.’
Quantitative variables describe numerical characteristics that can be measured or counted, and understanding their types helps determine appropriate statistical methods, interpretations, and graphical representations.
Understanding Quantitative Variables
A quantitative variable is a characteristic measured numerically, allowing meaningful arithmetic operations. These variables form the foundation of analyzing distributions, calculating summary statistics, and generating quantitative graphs.
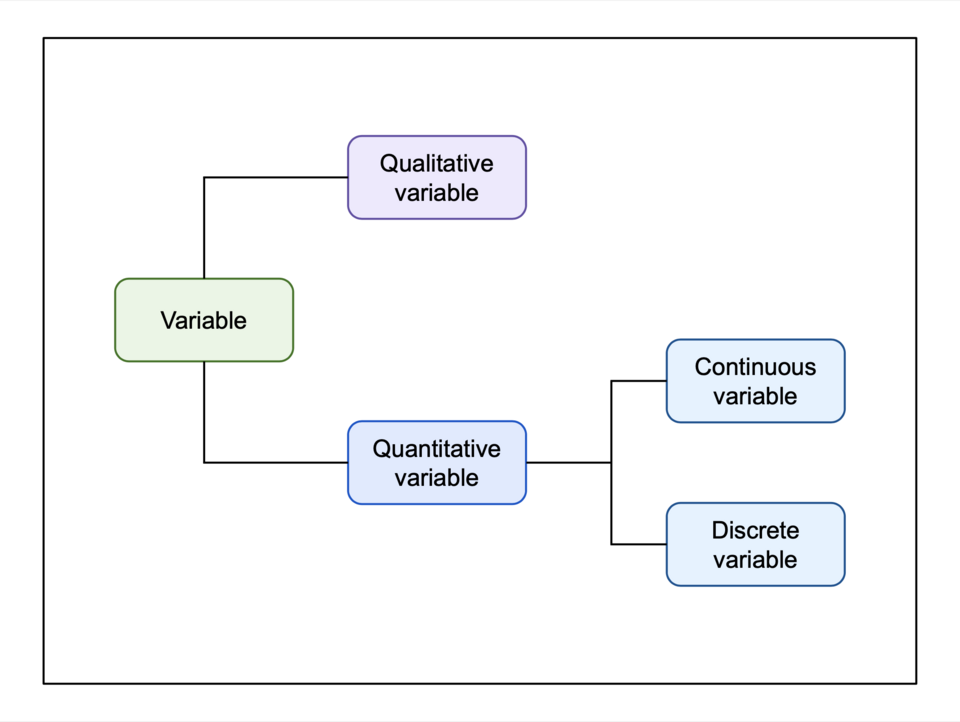
This schematic shows how discrete and continuous variables fit within the broader classification of variables. It adds categorical variables for context, extending slightly beyond the syllabus but reinforcing conceptual structure. The branching layout highlights the shared numerical foundation of discrete and continuous variables while emphasizing their structural differences. Source.
Quantitative Variable: A variable that takes numerical values for which arithmetic operations, such as addition or averaging, are meaningful.
Quantitative variables differ fundamentally in how their values are generated and the structure of the underlying number set. This directly influences how data are collected, represented, and interpreted.
The Importance of Classifying Quantitative Variables
Accurately identifying the type of quantitative variable ensures the correct choice of statistical tools. Because many techniques are designed for specific kinds of numerical data, misclassification can lead to inaccurate interpretations or inappropriate mathematical operations. AP Statistics requires consistent attention to the distinction between discrete and continuous variables, as emphasized in the syllabus skills under Skill 2.A.
Discrete Quantitative Variables
A discrete variable is defined by the syllabus as a variable with countable values, which may be finite or countably infinite. These values arise from counting processes rather than measurement.
Discrete Variable: A quantitative variable whose possible values form a countable set, typically resulting from a counting process.
Discrete variables often come from natural counting situations where increments occur in whole units rather than fractions.

This image illustrates how one scenario can involve both discrete and continuous variables: the number of vials is a discrete count, while the volume of liquid in each vial is a continuous measurement. The laboratory context introduces no extra statistical concepts beyond these distinctions. It supports the idea that counting and measuring naturally give rise to different types of quantitative variables. Source.
Key Features of Discrete Variables
Countability: Values can be listed or enumerated, even if infinitely many.
Non-continuous jumps: Differences between successive values are non-infinitesimal.
Natural counting context: Each value represents a tally, total, or number of occurrences.
Common Sources of Discrete Data
Discrete variables typically arise in situations such as:
Counting individuals, objects, or events
Tallying occurrences of an outcome
Recording totals in categories with exact numerical increments
These characteristics guide appropriate graphical displays (such as dotplots or histograms with distinct bins) and determine how distributions should be interpreted.
Continuous Quantitative Variables
A continuous variable is described in the syllabus as one capable of taking infinitely many values that cannot be counted due to extremely fine intervals. These values result from measurement processes.
Continuous Variable: A quantitative variable whose possible values fill an entire interval on the number line, allowing infinitely many uncountable values.
Continuous variables arise when precision depends on the measuring instrument, and values can theoretically extend to an unlimited number of decimal places. Unlike discrete variables, they do not have natural gaps between successive values.
Key Features of Continuous Variables
Uncountably infinite values: Fill entire intervals, not separate points.
Measurement-based origin: Determined by tools such as scales, timers, or sensors.
Infinitesimal differences: Any two values have another valid value between them.
Continuous variables align with representations that emphasize density and interval-based structures, such as histograms, cumulative graphs, and boxplots.
Distinguishing Discrete and Continuous Variables
Core Differences
Nature of values: Discrete variables count; continuous variables measure.
Number sets: Discrete variables take values from countable sets; continuous variables span entire real intervals.
Precision and granularity: Discrete variables change in whole steps; continuous variables change through infinitesimally small increments.
Associated contexts: Discrete values appear in scenarios with finite or countably infinite outcomes; continuous values correspond to properties like length, weight, or time.
Why Classification Matters in AP Statistics
Students must be able to identify the type of quantitative variable because:
It determines the appropriate graphical display, such as dotplots for discrete data versus histograms for continuous distributions.
It informs the interpretation of summary statistics, particularly measures of spread.
It influences how models and probability distributions apply to the data.
It supports accurate communication of statistical findings within context.
Skill 2.A particularly emphasizes this classification competency, ensuring students understand not only the labels but their underlying conceptual differences.
Applying Classification in Context
Proper interpretation of real-world data requires attention to the source and nature of measurement or counting. Variables that seem numerical may not always behave as continuous or discrete values without context, so understanding the story behind the data remains essential for accurate classification and analysis.
FAQ
Start by examining how the value is produced. If it results from counting individual events or objects, it is discrete. If it arises from measuring some physical quantity, it is continuous.
Some values that appear numerical, such as serial numbers or postcodes, are actually categorical because they do not represent a measurable or countable physical property.
Always ask whether arithmetic operations (such as averaging) would make physical sense for the variable.
Yes. Any continuous measurement becomes artificially discrete when rounded or limited by the resolution of an instrument.
For example, a length measured with a ruler marked in millimetres is still continuous in reality, but the recorded values will appear in discrete steps.
This does not change the true nature of the variable; it simply reflects measurement limitations rather than the underlying physics.
In many practical situations, time is sampled at fixed intervals, such as once every second or at each sensor trigger.
This sampling produces a series of discrete time points, even though time itself is continuous.
The distinction matters because sampled time data must be analysed as a discrete sequence, especially when plotting time-series data or performing digital analysis.
Yes. Some variables switch classification depending on how they are defined or measured.
Examples include:
• Energy levels in quantum systems (discrete) versus macroscopic energy measurements (continuous)
• Charge count (discrete electrons) versus measurable electric charge (continuous approximation)
The key is to consider the physical scale and the level of modelling needed for the experiment.
Different variable types are best represented using different graphical methods.
• Discrete variables suit bar charts or dotplots, where separated values are visually distinct.
• Continuous variables suit line graphs, histograms, or scatter plots, where data span a full interval.
Using the wrong display can hide trends, exaggerate noise, or misrepresent how values relate to the underlying physical process.
Practice Questions
Question 1 (2 marks)
A student is recording data for an experiment. For each trial, they note the number of sparks emitted by a discharge tube and the time taken for the sparks to occur.
(a) Identify which of these two quantities is a discrete variable and which is a continuous variable.
(b) State one reason for your choice.
Question 1 (2 marks)
(a)
Number of sparks is discrete. (1 mark)
Time taken is continuous. (1 mark)
(b) Award credit for any one of the following explanations linked correctly:
Discrete variables arise from counting whole events.
Continuous variables can take any value within a range or come from measurement.
(Maximum 2 marks total.)
Question 2 (5 marks)
In an investigation into thermal expansion, a metal rod is heated and its length is recorded at regular temperature intervals.
(a) Explain why the measured length of the rod is considered a continuous variable.
(b) The experiment also involves counting the number of times a digital sensor triggers during expansion events. Explain why this quantity is discrete.
(c) Discuss how misclassifying these variables could affect the choice of graph type and the interpretation of the results.
Question 2 (5 marks)
(a)
Length is continuous because it is measured and can take any value within a range. (1 mark)
Measuring instruments allow values with increasingly fine resolution. (1 mark)
(b)
Number of sensor triggers is discrete because it is counted in whole numbers. (1 mark)
(c)
Award up to 2 marks for any of the following, up to a maximum of two well-explained points:
Misclassifying variables may lead to using an inappropriate graph type (e.g., using a bar chart for continuous data). (1 mark)
It may cause incorrect interpretation of trends or distributions. (1 mark)
It may lead to unsuitable statistical treatment or assumptions. (1 mark)
(Maximum 5 marks total.)
