
AP Syllabus focus:
‘Discussing how summary statistics for two categorical variables can be leveraged to compare distributions across different categories or to determine associations between variables. Illustrating the application of marginal and conditional relative frequencies in comparing distributions, emphasizing the detection of patterns, similarities, or differences that may indicate associations. Skill 2.D: Enhancing the ability to use summary statistics effectively to compare categorical data distributions and assess potential relationships. Essential Knowledge UNC-1.R.1: Focusing on practical strategies for comparing distributions of two categorical variables using calculated statistics to uncover potential associations.’
Comparing distributions for two categorical variables uses summary statistics to reveal patterns, differences, or associations, helping determine whether categories behave similarly or show meaningful variability across groups.
Understanding Summary Statistics for Two Categorical Variables
When analyzing two categorical variables, summary statistics provide a structured way to compare how the distribution of one variable changes across the categories of another. These statistics typically come from a two-way table, which organizes joint, marginal, and conditional relative frequencies that reveal key features of the relationship.
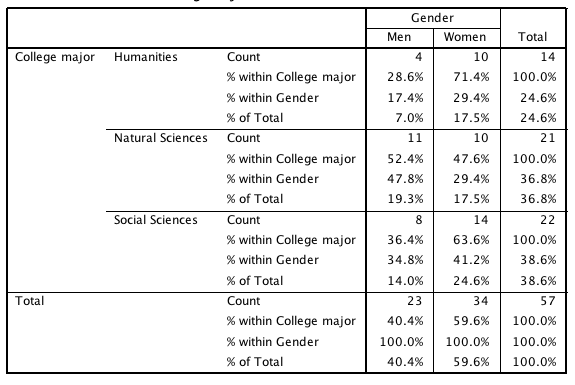
This two-way table displays the distribution of gender by major, using counts and percentages to highlight marginal and conditional relative frequencies essential for comparing categorical distributions. The specific majors and gender labels exceed syllabus scope, but the structure directly illustrates how summary statistics reveal relationships between variables. Source.
Because categorical variables do not support numerical operations such as averaging or standard deviation, the comparison relies on proportions. These proportions capture how frequently categories occur and how those frequencies differ across groups. Understanding these patterns is essential for determining whether an association may exist between the variables.
Using Marginal Relative Frequencies to Compare Overall Distributions
Marginal relative frequencies represent the proportion of observations in each row or column relative to the total number of observations. They help describe the overall distribution of each variable separately, before assessing how the variables relate across categories.
Marginal Relative Frequency: The proportion of observations belonging to a row or column category, calculated by dividing the row or column total by the grand total.
These proportions help identify dominant or minor categories, setting a baseline before deeper comparison. For example, if one category appears far more often overall, its distribution across subgroups may need careful interpretation to avoid misrepresenting associations.
Conditional relative frequencies, introduced next, enable a more detailed comparison by focusing on subgroups.
Conditional Relative Frequencies for Comparing Distributions Across Groups
Conditional relative frequencies describe the proportion of observations in each cell relative to the total for that row or column. These frequencies highlight how the distribution of one variable varies within levels of the other variable.
Conditional Relative Frequency: A proportion calculated by dividing a cell frequency by the total frequency of its row or column, representing how a category is distributed within a subgroup.
These values allow meaningful comparisons because they show patterns that may not appear in marginal totals.
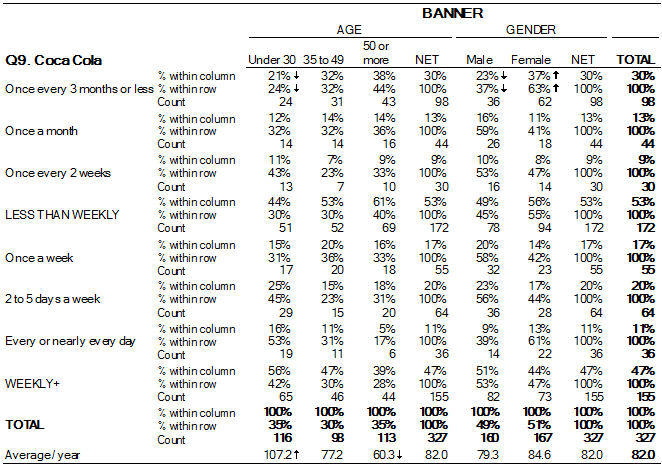
This table summarizes cola preference across demographic groups, using counts and conditional percentages to illustrate how distributions vary across categories. Although the variables differ from those in the syllabus, the design accurately models how conditional relative frequencies support distribution comparison. Source.
A normal sentence appears here to ensure clarity before moving to subsequent structured material.
What Conditional Relative Frequencies Reveal
When comparing distributions, conditional relative frequencies are often the most informative statistics because they allow analysts to see whether categories of one variable occur more or less frequently across the categories of another. Key insights include:
Whether categories of one variable appear equally across groups.
Whether a clear pattern of increasing or decreasing proportions emerges across categories.
Whether some categories show unexpectedly high or low proportions, suggesting possible associations.
The consistency or inconsistency among conditional relative frequencies across groups is central to determining whether variables are related.
Identifying Associations Through Summary Statistics
Summary statistics allow analysts to assess associations by identifying patterns that deviate from what would be expected if two variables were independent. When comparing distributions, the following considerations help determine whether an association is plausible:
Indicators of Association
Conditional relative frequencies that differ substantially across groups.
Patterns of increase or decrease in proportions aligned with category changes.
Distinctive differences between subgroups that remain strong even when overall marginal frequencies are unequal.
Indicators of Little or No Association
Conditional relative frequencies that remain roughly similar across all categories.
No visible pattern or trend in how the proportions change.
Minimal difference between joint proportions relative to what would be expected under independence.
These observations align directly with Skill 2.D, which emphasizes using summary statistics to compare distributions and evaluate potential relationships.
Structured Strategies for Comparing Distributions
To effectively compare categorical distributions, students should develop a systematic approach grounded in the syllabus expectations. The steps below reflect practical strategies aligned with Essential Knowledge UNC-1.R.1:
Step-by-Step Strategy
Identify the variables and determine which will serve as the basis for comparison.
Construct or examine a two-way table, ensuring categories are clearly labeled.
Calculate marginal relative frequencies to understand general distributions.
Calculate conditional relative frequencies to explore differences within subgroups.
Compare conditional frequencies across categories, noting similarities, differences, and patterns.
Assess whether variability in conditional proportions suggests an association, being careful not to infer causation.
A normal sentence is included here to maintain readability before additional structured content.
Common Interpretation Pitfalls to Avoid
Assuming association from marginal distributions alone, which do not describe subgroup behavior.
Misinterpreting small differences that may arise from randomness rather than meaningful patterns.
Concluding causation from association, which is not supported by categorical summary statistics.
Using Summary Statistics to Detect Patterns
Interpreting patterns in conditional relative frequencies allows students to identify similarities or differences across categories. Observing whether distributions align, diverge, or shift significantly supports the detection of associations.
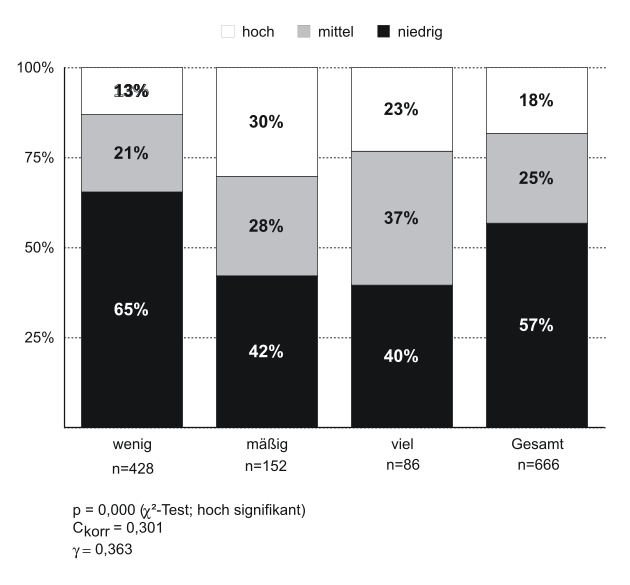
This 100% stacked bar chart visualizes conditional relative frequencies within each category, allowing direct comparison of proportional differences across groups. Although the labels are in German, the structure clearly demonstrates how categorical distributions can be contrasted using relative segment heights. Source.
FAQ
A difference is practically meaningful if it is large enough to suggest a real behavioural or categorical shift rather than random variation.
Consider the scale of the proportions: a difference of 1–2 percentage points may be trivial, while gaps of 10–20 points often indicate substantial divergence.
Context also matters. In some settings, even small differences could indicate meaningful change if the categories are highly sensitive or tightly regulated.
Raw counts may reflect differing group sizes, making comparisons misleading. Conditional relative frequencies standardise the data so groups can be compared on equal footing.
They allow you to focus on how a categorical variable behaves within each subgroup, regardless of sample size differences.
This ensures that any pattern or association observed is not simply due to one category having more individuals overall.
Frequent errors include confusing row-based and column-based percentages, leading to incorrect comparisons.
Another common mistake is examining only one subgroup and generalising patterns across all categories.
Students may also misinterpret very small sample sizes, where a large conditional percentage does not necessarily indicate a strong pattern.
Careful attention to denominator choice and sample size helps avoid these issues.
Graphs such as segmented bar charts or mosaic plots can highlight differences in conditional proportions more clearly than tables alone.
They provide instant visual cues such as relative segment size or shifts in bar composition.
Visualisation is especially helpful when patterns are subtle or when communicating findings to non-technical audiences.
Look for consistent patterns across all categories rather than isolated differences.
Consider whether differences align logically with contextual expectations.
Use the following checks:
• Are the differences large and systematic across groups?
• Do they remain notable even after considering sample sizes?
• Are the patterns unlikely to be due to chance alone?
These strategies support stronger interpretation without overreliance on any single statistic.
Practice Questions
Question 1 (1–3 marks)
A school records students’ preferred study location (Library or Home) and their year group (Lower School or Upper School). The conditional relative frequency of preferring the Library is 0.62 for Lower School students and 0.41 for Upper School students.
Using these conditional relative frequencies, state whether there is evidence of an association between year group and preferred study location. Justify your answer.
Question 1 (1–3 marks)
• 1 mark: States that the conditional relative frequencies differ meaningfully between the two year groups.
• 1 mark: Correctly identifies that this difference suggests an association between year group and preferred study location.
• 1 mark: Provides a brief justification referring to the size or direction of the difference (e.g., Lower School students show higher preference for the Library).
Total: 3 marks
Question 2 (4–6 marks)
A survey records whether residents support a local recycling initiative (Support or Do Not Support) and whether they live in an urban, suburban, or rural area. The conditional relative frequencies of supporting the initiative are as follows:
Urban: 0.78
Suburban: 0.63
Rural: 0.45
(a) Compare the distributions of support across the three areas using the conditional relative frequencies.
(b) Explain whether the data provide evidence of an association between area type and level of support.
(c) Give one reason why these data do not allow you to conclude that area type causes differences in support.
Question 2 (4–6 marks)
(a)
• 1 mark: Identifies which area has the highest and lowest conditional relative frequency of support.
• 1 mark: Describes how support decreases from urban to suburban to rural.
(b)
• 1 mark: States that the differences in conditional relative frequencies indicate an association between area type and level of support.
• 1 mark: Explains that the variation across areas is substantial enough to suggest a relationship.
(c)
• 1 mark: States a valid reason why causation cannot be inferred (e.g., observational data, possible confounding variables).
Total: 6 marks
