
AP Syllabus focus:
‘This section will introduce bivariate quantitative data sets, consisting of observations of two different quantitative variables made on individuals in a sample or population. It will explain the purpose and the general concept of analyzing two-variable data to uncover relationships between variables.’
Bivariate quantitative data analysis helps reveal how two numerical variables measured on the same individuals may be related, offering a foundation for exploring meaningful statistical relationships.
Understanding Bivariate Quantitative Data
Bivariate quantitative data refers to paired numerical observations collected from each individual or unit in a sample or population. Each observation includes two quantitative measurements, allowing statisticians to explore how changes in one variable may correspond to changes in the other. This type of data is central to investigating whether variables move together in predictable ways or whether their association appears random.
A quantitative variable is a variable measured numerically, such as height, time, temperature, or income. When two such variables are examined simultaneously, opportunities arise to uncover underlying trends, associations, or potentially useful patterns.
Bivariate Quantitative Data: A set of paired numerical observations for two quantitative variables measured on the same individuals.
Analyzing these paired values allows researchers to address statistical questions involving relationships rather than single-variable summaries. This analytical shift is foundational for regression, correlation, and other methods used throughout two-variable statistics.
Components of a Bivariate Data Set
A bivariate data set typically includes:
Individuals or units of observation, the sources from which paired measurements are taken.
Two quantitative variables, each offering meaningful numerical information.
Ordered pairs, where each value of one variable corresponds directly to a value of the other.
These elements combine to form a structure suitable for evaluating relationships. Each pair captures simultaneous information, enabling analyses that go beyond the limitations of one-variable data summaries.
When exploring such relationships, it is essential to recognize that patterns may emerge due to genuine underlying connections or may simply reflect variability. The purpose of analyzing bivariate quantitative data is to determine whether observed patterns appear meaningful, random, or influenced by other factors.
Why Study Relationships Between Variables?
Studying relationships in bivariate data provides insights into how one quantitative variable behaves when another changes. This helps in:
Describing and visualizing associations.
Assessing whether variables display increasing, decreasing, or no consistent trends.
Preparing for more advanced modeling, such as linear regression.
These analyses support inferences about the structure of data and facilitate predictions when relationships appear sufficiently stable.
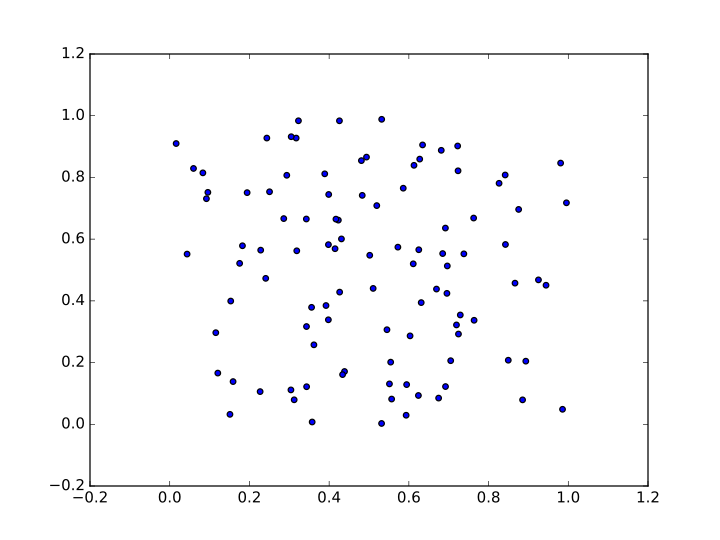
A simple scatterplot illustrating paired numerical observations, where each point represents one ordered pair of quantitative measurements for an individual. Source.
Association: A general term describing any relationship between two variables in which changes in one variable correspond to changes in the other.
Researchers must remain cautious, recognizing that an association does not inherently indicate a cause-and-effect relationship. Randomness, sampling variation, or unobserved external influences may all produce apparent patterns.
Collecting and Organizing Paired Measurements
To analyze two-variable relationships effectively, data must be organized systematically. Common approaches include:
Creating a two-column table where each row represents an individual and each column represents one quantitative variable.
Listing values as ordered pairs (x, y), preserving the correspondence between variables.
Preparing the data for visual representation, such as through scatterplots, which will be addressed in later subsubtopics.
Such organization ensures that the structure of the relationship remains clear.
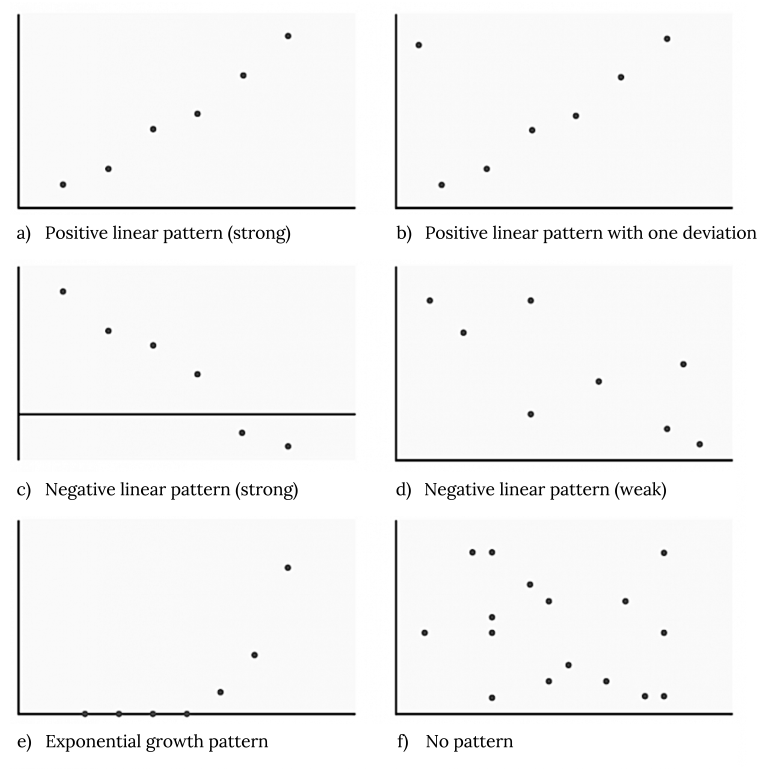
A set of scatterplots showing a range of possible patterns in bivariate quantitative data, including positive, negative, nonlinear, and no visible relationships. Source.
The Role of Question Formulation in Two-Variable Analysis
Bivariate studies often begin with a research question that guides the investigation. Examples include exploring whether time spent studying relates to exam scores, whether temperature affects electricity usage, or whether product price corresponds to demand.
These questions must explicitly involve two quantitative variables and reflect the goal of investigating a potential relationship. Formulating such questions encourages careful consideration of whether any observed association could be due to typical variation rather than a structural link.
Research Question (Two-Variable): A statistical question focused on exploring a potential relationship between two quantitative variables measured on the same individuals.
Asking well-constructed questions helps ensure that analyses remain purposeful and aligned with sound statistical thinking.
Variation and the Search for Patterns
A key concept in bivariate quantitative analysis is variation, the natural differences found within data. Variation exists within each variable individually and also manifests in how variables relate to one another. When examining paired measurements, it is crucial to acknowledge that:
Some patterns arise from genuine relationships.
Some patterns appear only due to randomness.
Observed associations must be interpreted cautiously.
Understanding variation helps prevent over-interpretation of coincidental trends and supports a disciplined approach to evaluating whether data justify meaningful conclusions.
Foundations for Further Analysis
Introducing bivariate quantitative data sets the stage for the graphical and numerical tools that follow. Subsequent topics such as scatterplots, correlation, and regression will build upon this foundational understanding by offering formal techniques for describing and quantifying relationships. At this introductory level, the emphasis remains on recognizing what bivariate data represent and why studying two-variable relationships is essential within statistical inquiry.
FAQ
Bivariate quantitative data require paired measurements taken from the same individuals, allowing analysts to examine how one variable behaves in relation to the other.
Two separate univariate data sets do not preserve this pairing. Even if they describe similar groups, you cannot investigate relationships because there is no link between individual values.
Ideal research questions focus on how one numerical variable changes alongside another. These usually include words such as relationship, association, pattern, or trend.
Examples of suitable question types include:
• Predictive questions exploring whether one variable can help anticipate values of another.
• Comparative questions about whether increases or decreases in one measurement correspond to changes in a second measurement.
The first and second positions in each pair must remain consistent to avoid mixing the variables. Swapping the order destroys the meaningful correspondence between values.
Maintaining a clear variable order ensures that any graphical display or calculation accurately reflects the intended explanatory and response roles, even though those roles may not yet be formally defined at this introductory stage.
Common issues include measurement error, inconsistent tools, or failing to record both variables simultaneously.
Practical considerations include:
• Ensuring that both variables are measured under similar conditions.
• Avoiding missing data, which weakens the structure of paired observations.
• Keeping units consistent and clearly recorded.
High variability within one or both variables can mask underlying patterns, especially with small sample sizes.
Other reasons include:
• The relationship may be nonlinear, meaning simple visual inspection looks inconclusive.
• External factors influencing one variable may obscure its association with the other.
• Human error or imprecise measurement can introduce noise, weakening visible patterns.
Practice Questions
Question 1 (1–3 marks)
A researcher records the height (in centimetres) and handspan (in centimetres) of each student in a class. Explain what makes this a set of bivariate quantitative data and state what each ordered pair represents.
(3 marks)
Question 1 (3 marks)
• 1 mark for stating that it is bivariate because two variables are measured for each individual.
• 1 mark for identifying that both variables (height and handspan) are quantitative because they are numerical measurements.
• 1 mark for stating that each ordered pair represents one student’s height and corresponding handspan.
Question 2 (4–6 marks)
A study investigates whether daily revision time (in minutes) is associated with maths test scores (out of 100) for a group of pupils.
a) Explain why collecting both measurements for each pupil is necessary for analysing the relationship between the variables.
b) Describe how the data should be organised before creating a graphical display.
c) Give one reason why an observed pattern in the data might not represent a meaningful relationship between the variables.
(6 marks)
Question 2 (6 marks)
a)
• 1 mark for stating that both variables must be measured on the same individuals to investigate a relationship.
• 1 mark for explaining that without paired measurements, no association can be assessed.
b)
• 1 mark for stating that data should be organised in a two-column table or list of ordered pairs.
• 1 mark for noting that each row/ordered pair must contain the revision time and the corresponding score for the same pupil.
c)
• 1 mark for identifying randomness, natural variation, or influence of an external unmeasured factor as a reason patterns may not indicate a true relationship.
• 1 mark for a clear explanation of why this could create an apparent but misleading pattern.
