
AP Syllabus focus:
‘Detailed steps on how to calculate the correlation coefficient (r) using the formula: r = Σ(xy) - Σx*Σy / n sqrt((Σx^2 - (Σx)^2 / n) (Σy^2 - (Σy)^2 / n)). It will emphasize that while this formula is fundamental, the use of technology is the most common method for determining r in practice. The section will guide on how to interpret the calculated r value in terms of strength and direction of the linear relationship.’
The correlation coefficient provides a numerical measure of linear association between two quantitative variables, enabling analysts to evaluate relationship direction and strength using consistent, standardized criteria.
Understanding the Purpose of the Correlation Coefficient
The correlation coefficient, denoted r, quantifies the direction and strength of a linear association between two quantitative variables. This measure is central to bivariate data analysis because it condenses information about covariation into one interpretable value.
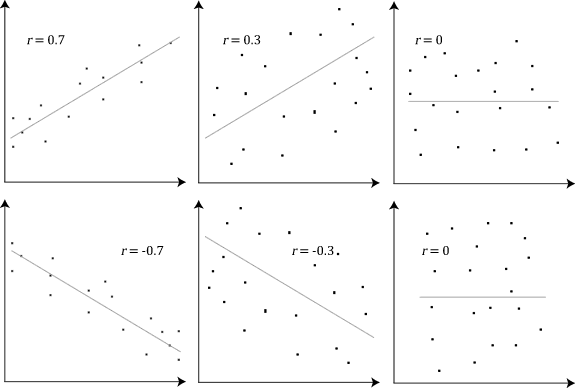
These scatterplots illustrate how patterns of points correspond to various values of the correlation coefficient, showing stronger clustering for larger magnitudes of r and more diffuse clouds near r = 0. Source.
Although students often compute r with technology, understanding the underlying structure of the formula deepens conceptual mastery of how patterns in paired data translate into numerical values.
To use the coefficient correctly, it is important to recognize that r only describes linear relationships, and it does not capture nonlinear patterns even when strong associations exist. Because of this limitation, the correlation coefficient must always be paired with a visual analysis of the data to ensure that a linear model is appropriate before interpreting its meaning.
Components of the Correlation Formula
The AP syllabus provides a specific algebraic expression for computing r, illustrating how sums of products and sums of squared values interact to quantify linearity.
EQUATION
= Correlation coefficient (unitless)
= Explanatory variable values
= Response variable values
= Number of paired observations
= Sum of the products of paired values
and = Sums of each variable’s values
and = Sums of squared values
Although this formula is mathematically precise, it is rarely computed by hand in practical settings. Nonetheless, understanding its components reinforces why correlation is sensitive to both joint variation and individual variability.
Technology provides a more efficient method for finding r, but students should still be comfortable identifying the quantities represented in the formula, recognizing how deviations from means contribute to covariance, and explaining conceptually why r rises or falls in magnitude.
Interpreting the Calculated Correlation Coefficient
Once computed, the correlation coefficient must be interpreted using standardized language that reflects both its sign and magnitude. Values of r always fall between –1 and 1, offering a consistent metric for evaluating linear association strength.
Linear Association Strength: A descriptive assessment of how closely data points follow a straight-line pattern, indicated by the absolute value of r.
A positive value of r indicates that higher x-values tend to be paired with higher y-values, reflecting a positive linear association. A negative value indicates that higher x-values tend to be paired with lower y-values, signaling a negative linear association. The farther the value lies from zero, the stronger the linear association.
Interpreting r accurately requires precise wording. Students should describe both the direction and strength of association and reference the idea of linearity explicitly. An interpretation must never imply causation; correlation quantifies association, not influence.
Practical Considerations When Using r
While the computation of r is formula-based, the AP curriculum emphasizes that technology is the preferred method for obtaining numerical values. Graphing calculators, spreadsheets, and statistical software quickly compute the coefficient and reduce human error that might occur when managing multiple summations.
Regardless of the method used to compute r, students must remain aware of the context and the underlying data features. Correlation is not resistant to unusual points, meaning that outliers and clusters can distort the magnitude of r significantly.
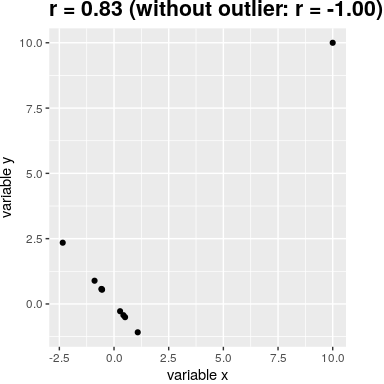
This scatterplot demonstrates how an extreme outlier can shift the correlation coefficient dramatically, even reversing its sign, despite the clear negative pattern in the main cluster of points. Source.
Before relying on a calculated coefficient, analysts should examine scatterplots to ensure data suitability.
Outlier (in correlation): A data point with an unusually large residual or atypical position that can substantially affect the value of r.
This awareness supports better decision-making, especially when interpreting the relationship between variables that may be prone to extreme or influential observations.
In addition, correlation does not measure the appropriateness of a linear model on its own. A strong r does not guarantee linearity, and a weak r does not rule out nonlinear associations. Therefore, the computation of r should always appear alongside a reliable graphical representation of the data.
Summary of Key Skills for AP Students
To align with the syllabus expectations, students should be able to:
Identify situations where calculating r is appropriate for assessing linear association.
Explain conceptually how the correlation coefficient reflects joint variability.
Use technology to compute r accurately and efficiently.
Interpret the resulting r value in terms of direction and strength.
Recognize the limitations of correlation and avoid overstating its implications.
Pair numerical results with graphical analysis for meaningful conclusions.
FAQ
Correlation is based on how well data points fit a straight-line pattern, so it only captures the degree to which increases or decreases in one variable align proportionally with the other.
Curved patterns may show strong association, but because the relationship is not linear, the correlation coefficient does not reflect the strength of that pattern.
To detect curved associations, analysts must rely on plots or alternative modelling techniques rather than correlation alone.
Adding or subtracting a constant to all values of one variable does not change the correlation coefficient.
This is because correlation standardises the data by focusing on how the values vary relative to their means, not their absolute values.
Only changes to the pattern of variability or scaling affect correlation.
Yes. A correlation near zero indicates no linear association, not necessarily the absence of any relationship.
Strong curved or cyclical relationships can exist even when the correlation coefficient is extremely small.
Scatterplots are essential for detecting these non-linear patterns.
The formula for correlation treats the paired deviations of x and y symmetrically, so reversing their roles leaves the value of r unchanged.
This symmetry reflects that correlation measures association, not prediction.
In contrast, regression does change when the explanatory and response variables are swapped.
Correlation involves multiple sums and squared terms, so small rounding errors can accumulate and change the final value of r.
This is especially important when values of r are close to classification thresholds such as weak versus moderate association.
To reduce rounding error, use unrounded data or rely on statistical software that maintains higher precision.
Practice Questions
A researcher calculates the correlation coefficient between students’ hours of revision and their exam scores and obtains r = 0.62.
(a) State the direction of the association.
(b) State the strength of the association.
(1–3 marks)
Question 1 (1–3 marks)
(a) 1 mark: Identifies the direction as positive.
(b) 1 mark: Identifies the strength as moderate.
1 additional mark (optional if needed for a 3-mark total): Uses correct statistical terminology such as “positive linear association” or “moderate positive correlation.”
A data set of paired values (x, y) is analysed to investigate whether a linear relationship exists between two quantitative variables. The following summary statistics are provided:
Sum of x-values = 112
Sum of y-values = 150
Sum of products xy = 4,380
Sum of x-squared values = 1,520
Sum of y-squared values = 3,070
Sample size n = 20
(a) Using the correlation coefficient formula, describe the steps required to compute r from these summary statistics.
(b) Explain how the value of r, once calculated, would be interpreted in context.
(c) Explain why calculating r alone is not sufficient to conclude that a linear model is appropriate for the data.
(4–6 marks)
Question 2 (4–6 marks)
(a) Up to 3 marks:
1 mark: States that the correlation coefficient formula requires substituting the summary statistics into the standard expression involving sums, products, and squared values.
1 mark: States that the numerator involves the sum of products minus the product of sums divided by n.
1 mark: States that the denominator requires taking the square root of the product of two variance-like expressions based on x and y.
(b) Up to 2 marks:
1 mark: Mentions interpreting r by describing both direction (positive/negative) and strength (weak/moderate/strong).
1 mark: States that interpretation must be made in context (referring to the variables being studied).
(c) Up to 1 mark:
1 mark: Explains that r only measures linear association and does not confirm that a linear model is appropriate without examining a scatterplot for form, outliers, or nonlinearity.
