
AP Syllabus focus:
‘Detailed exploration of high-leverage points in regression, which are distinguished by their substantially larger or smaller x-values compared to the rest of the data. This section will cover how to identify high-leverage points and the potential influence they may have on the regression model.’
High-leverage points play a crucial role in evaluating the reliability of a linear regression model, making them essential to identify and understand when analyzing two-variable data.
Understanding High-Leverage Points in Regression
A high-leverage point is an observation whose x-value is far from the mean of the explanatory variable, giving it a disproportionately strong influence on the fitted regression line. These points arise naturally in data but must be carefully assessed because they can substantially alter the slope, y-intercept, and overall appearance of the model. Their identification allows analysts to determine whether the regression line accurately represents the relationship in the data or if it is being distorted by extreme values.
High-Leverage Point: An observation with an unusually large or small value for the explanatory variable x, granting it disproportionately strong potential to affect the regression line.
High-leverage points are not always outliers in the y-direction, which makes them less obvious when inspecting scatterplots. Instead, they require focused attention on the spread and extremity of x-values. Because regression seeks to minimize the squared residuals across x-values and y-values, an extreme x-value creates a long “arm” through which the fitted line may rotate, altering model behavior even if the corresponding y-value seems reasonably aligned with the overall trend.
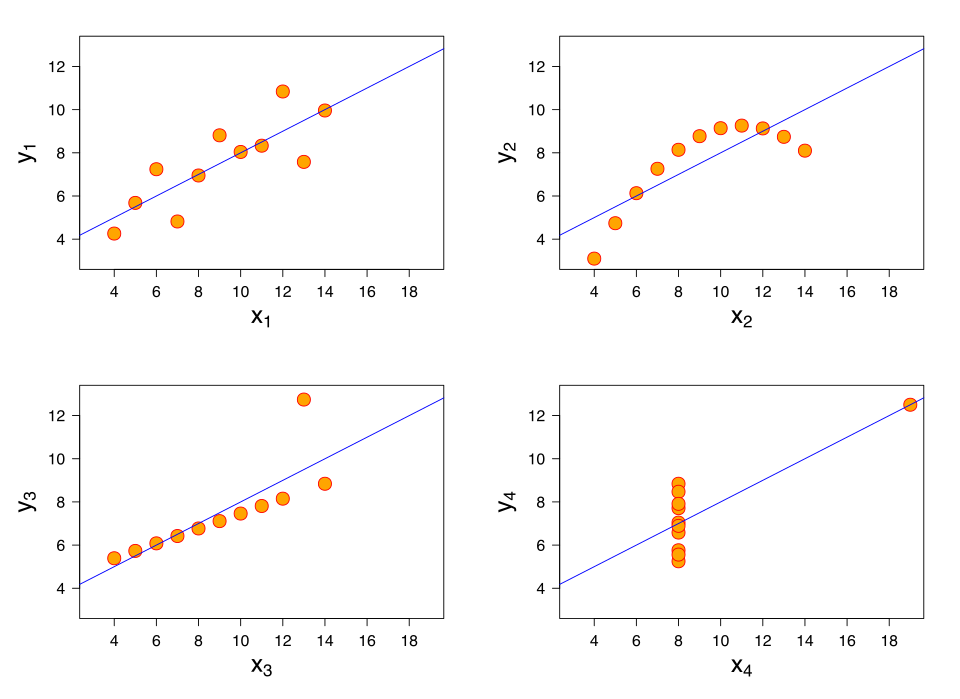
Scatterplots from Anscombe’s quartet showing how a single point with an unusually large x-value can pull the regression line. One panel contains a point far to the right that largely determines the fitted line, illustrating the idea of a high-leverage point. The other panels include extra patterns not required by the AP syllabus but reinforce why visual inspection of scatterplots matters. Source.
Why High-Leverage Points Matter
Influence on the Regression Equation
High-leverage points matter because they have the capacity to change the regression line in meaningful ways. When such a point is included, the slope may become steeper or flatter, and the y-intercept may shift notably. When removed, the regression line may appear entirely different, demonstrating the magnitude of the point’s leverage. This property helps distinguish leverage (extremity in x) from influence (actual change in model fit), even though high-leverage points frequently end up being influential as well.
Distinguishing Leverage From Outliers
Although both leverage points and outliers can affect a regression model, they stem from different sources of extremity:
A leverage point is extreme in x, regardless of its y-value.
An outlier is extreme in y, regardless of its x-value.
A point may be both a leverage point and an outlier, but these concepts are not interchangeable.
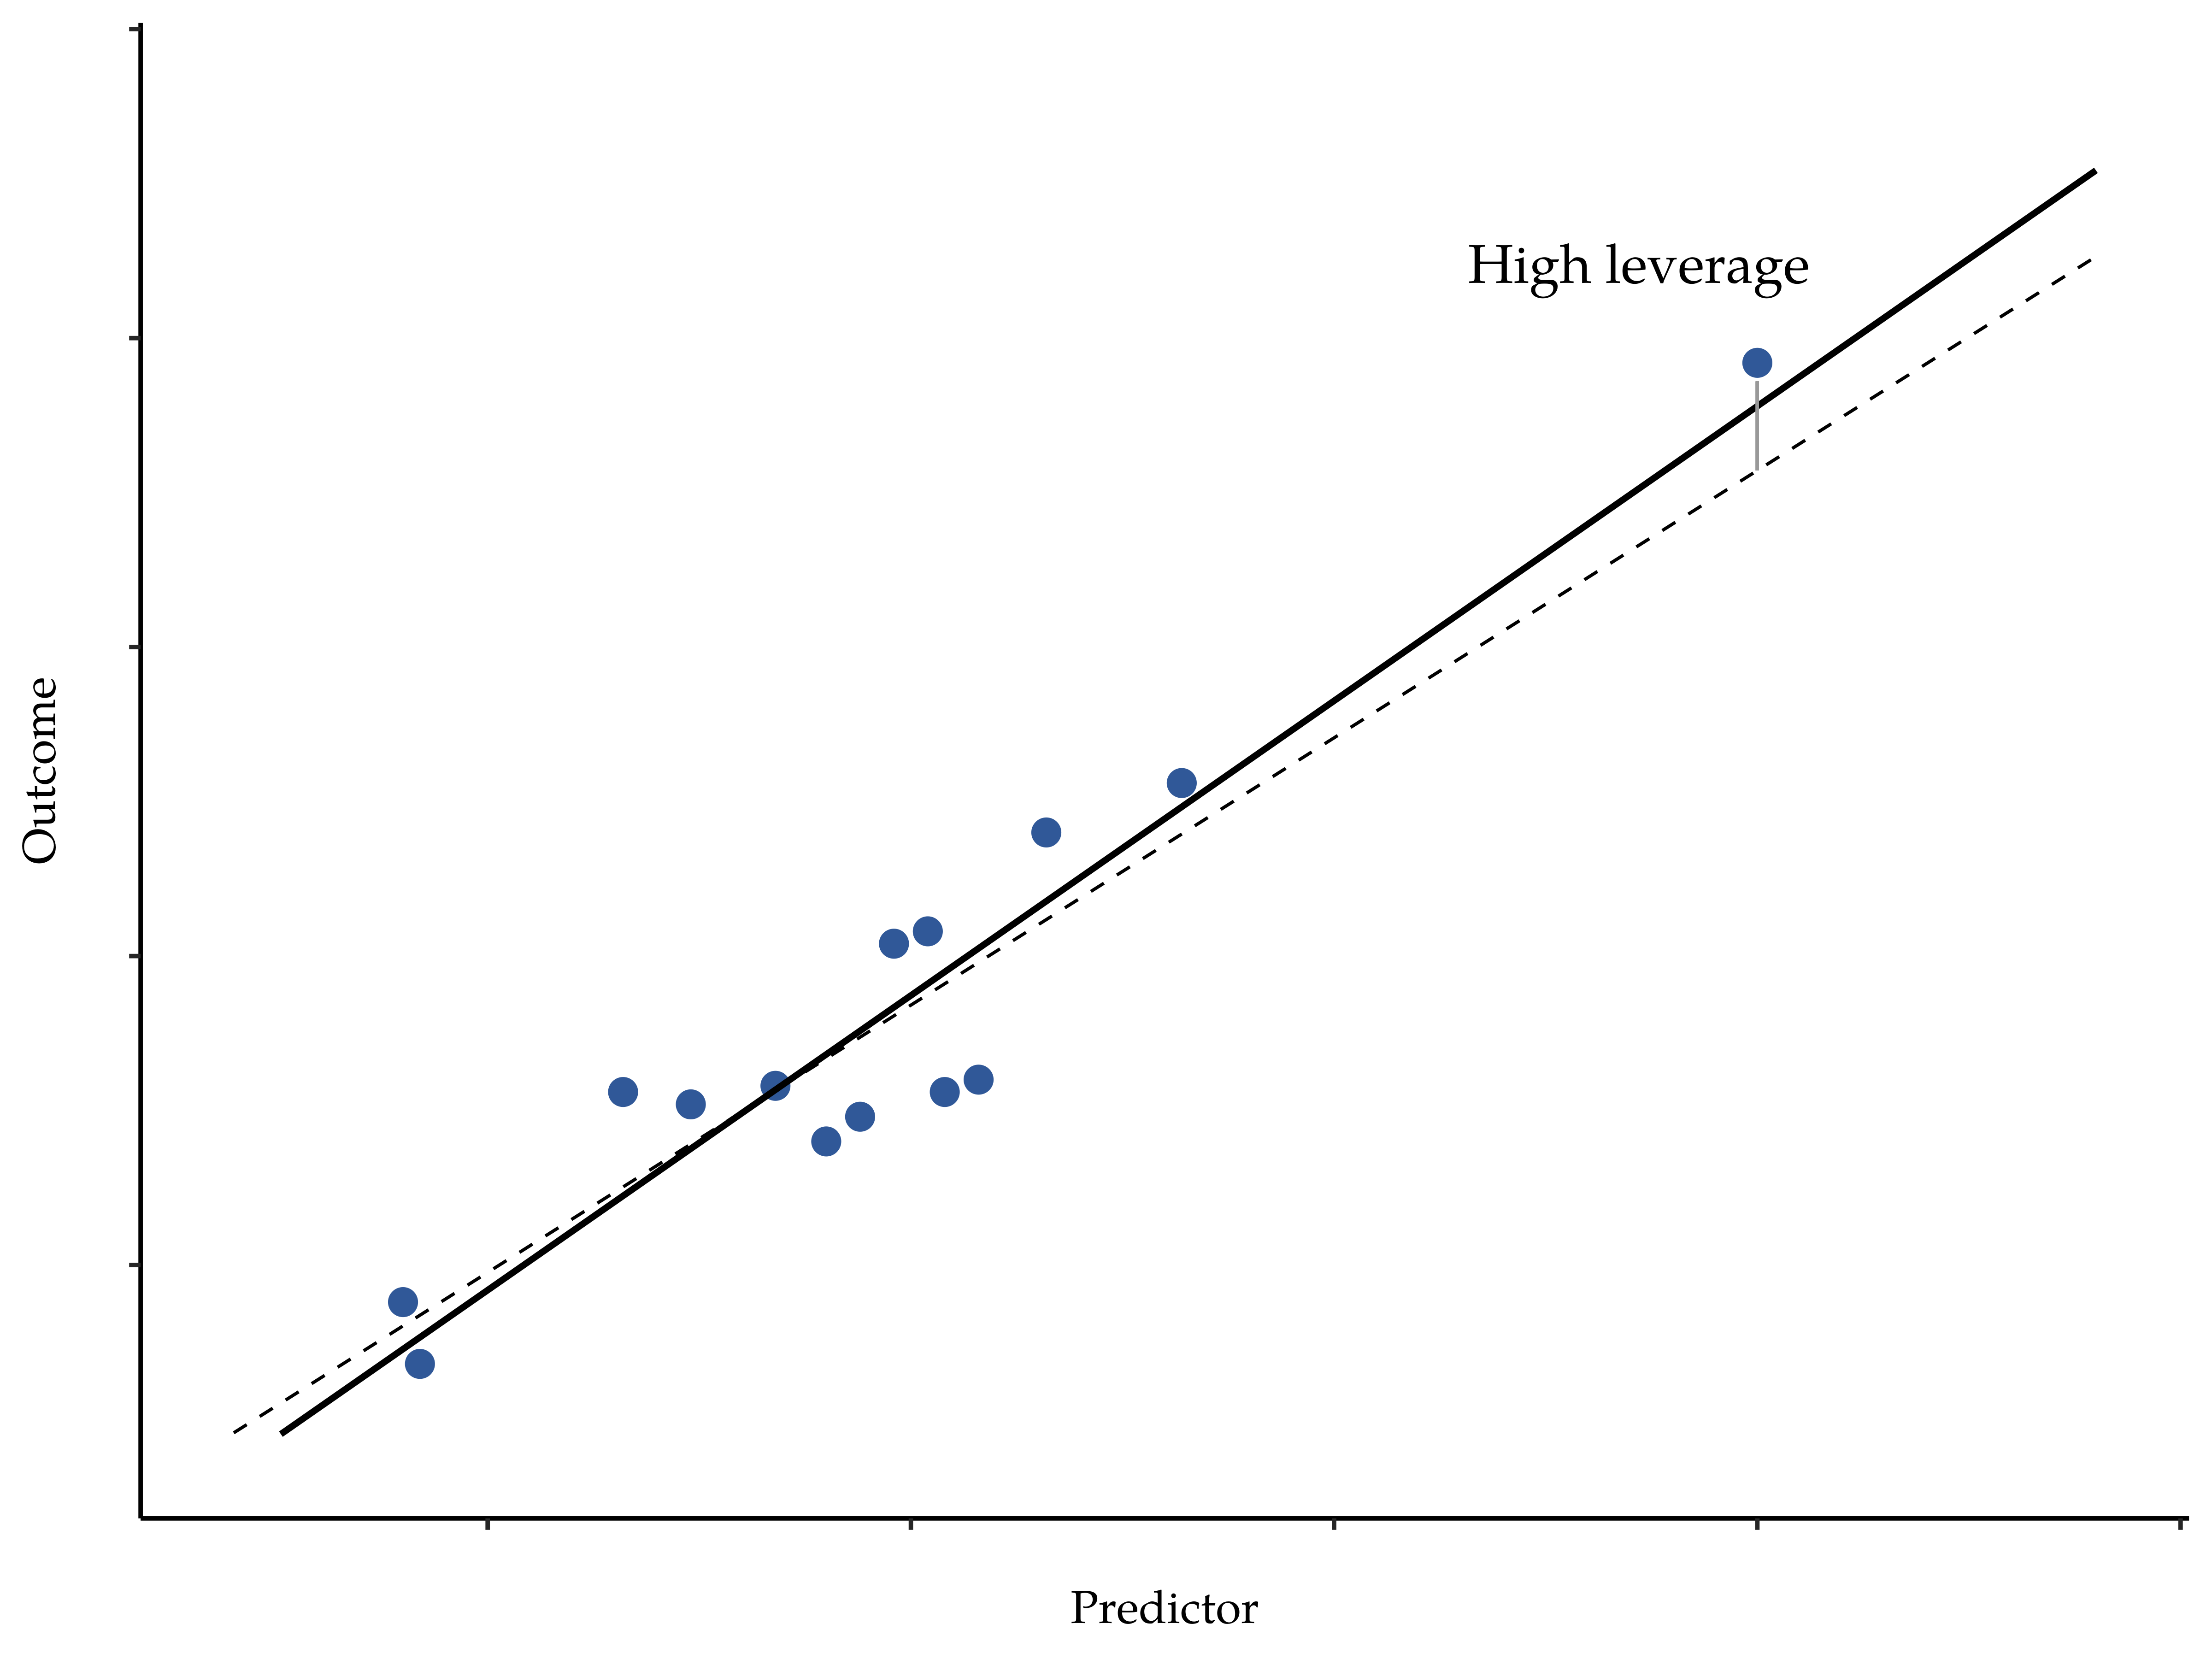
Scatterplot of an outcome versus a predictor with one point far to the right labeled as a high-leverage point. The solid and dashed regression lines represent fits with and without that extreme point, illustrating how leverage can rotate the regression line around the main cloud of data. This figure emphasizes extremity in x rather than in y, aligning with the AP definition of a high-leverage point. Source.
A point far to the left or right on the x-axis can steer the regression line even if it lies close to the line's predicted value, reinforcing the syllabus emphasis on the potential influence such x-extreme observations can exert.
Identifying High-Leverage Points
To identify high-leverage points, analysts typically examine the distribution of x-values.
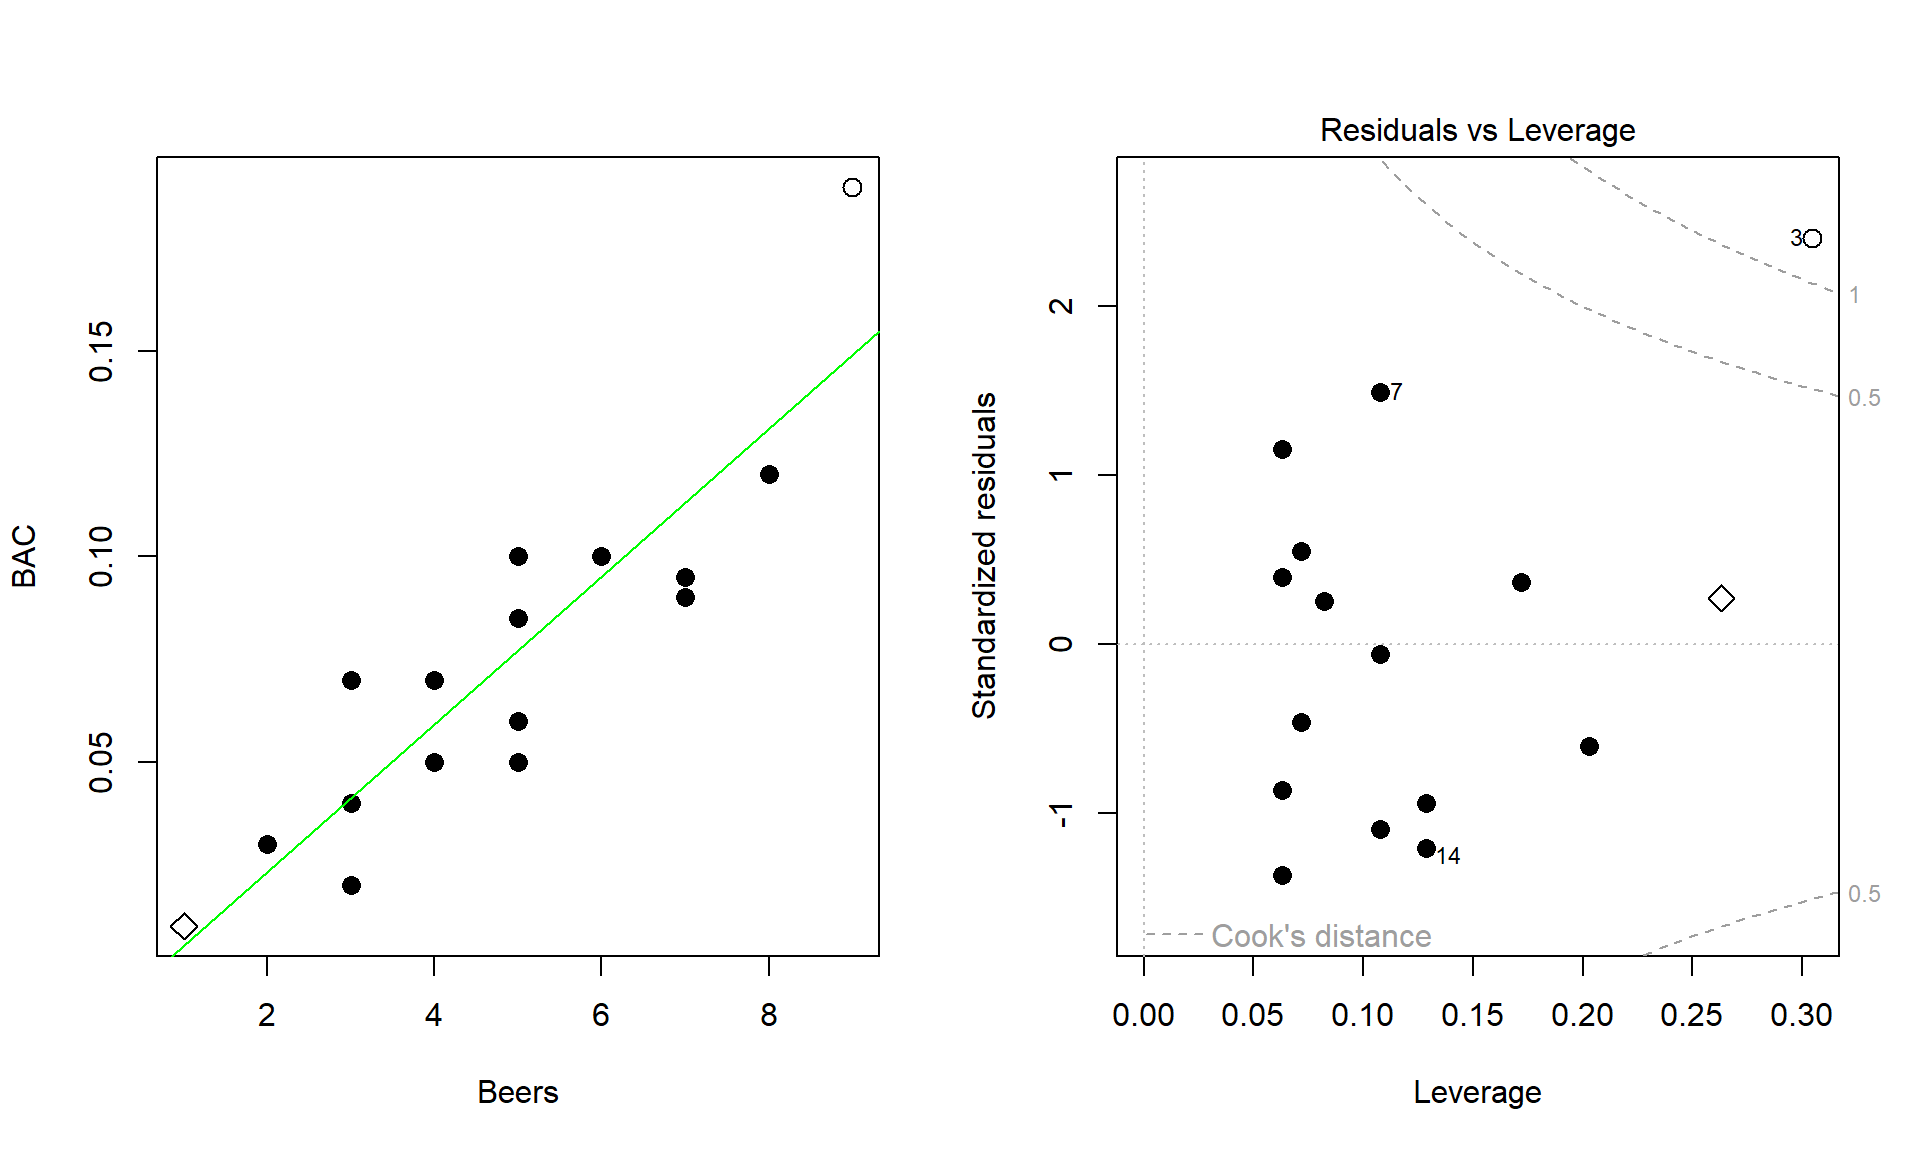
Left panel: scatterplot of BAC versus number of beers showing two far-right x-values. Right panel: residuals versus leverage plot highlighting these same points as high leverage, linking “far in x” to leverage. The Cook’s distance contours provide additional diagnostic detail beyond AP requirements. Source.
Methods for Identifying High-Leverage Points
Students should look for the following indicators:
Extremely low or high x-values relative to the cluster of the remaining data
Substantial gaps in the range of x, where one or a few points sit far from the rest
Points lying horizontally isolated even if their y-values appear typical
Residuals that may be small, despite disproportionately large effects on regression parameters
These traits collectively align with the AP specification’s intent to explore the distinguishing features of high-leverage points and their implications for regression analysis.
Normal regression diagnostics or software output may provide numerical leverage values, but for AP Statistics, conceptual recognition based on x-distance from the mean is the key skill emphasized.
The Effect of High-Leverage Points on Regression Analysis
High-leverage points can dramatically change how a model behaves. Their effects may include:
Changes in Slope and Intercept
Because the regression line attempts to minimize the squared residuals for all points, an extreme x-value can act like a hinge around which the line rotates. This can result in:
A noticeably different steepness compared to the trend suggested by the main cluster
A shifted vertical position of the line as the model attempts to accommodate the extreme x-value
A misleading representation of the overall association, particularly if the high-leverage point is not representative of typical behavior
Alterations in Measures of Fit
High-leverage points may artificially increase or decrease the strength of the linear association. For example, adding a point with an extreme x-value and a y-value that perfectly matches the projected trend could inflate the correlation coefficient or the coefficient of determination . Conversely, if the y-value departs from the trend, the same point could dramatically weaken the linear relationship.
These potential effects underscore why analyzing leverage is crucial for judging model credibility.
Strategies for Handling High-Leverage Points
When encountering high-leverage points, students should adopt careful, critical approaches, including:
Reevaluating the context to determine whether the x-value is valid or the result of an error
Comparing the regression line with and without the point to assess its influence
Considering the population or sampling method to understand whether the extremity is meaningful
Avoiding automatic removal, as extreme x-values may represent legitimate observations essential to the story of the data
These practices align closely with the syllabus requirement to examine high-leverage points not merely as anomalies but as potential drivers of important analytical insights.
FAQ
A high-leverage point is defined by an extreme x-value, whereas a point with a large residual is extreme in the y-direction relative to the fitted line.
A point may have a very small residual but still be high leverage if its x-value is far from the mean of the explanatory variable.
A practical way to distinguish them is:
• Look horizontally for leverage (extreme x).
• Look vertically for residual size (extreme y).
Not necessarily. High-leverage points can be completely legitimate observations, especially where the explanatory variable naturally spans a wide range.
They become problematic mainly when:
• They do not represent typical behaviour for the population.
• They disproportionately distort the regression model.
• They arise from unusual sampling or recording errors.
Evaluating context is essential before deciding whether the point is an issue.
The regression algorithm minimises the total squared residuals, and points with extreme x-values have a larger geometric effect on the slope.
Because they sit far from the centre of the x-distribution, even small adjustments in the line can greatly reduce their contribution to total error, causing the fitted line to rotate around them.
This rotational effect explains why leverage influences the line more than typical observations.
Yes. Correlation measures the strength of a linear association, and a high-leverage point can artificially strengthen or weaken this measure.
For example:
• If the point aligns well with the overall trend, correlation may increase.
• If the point diverges even slightly from the trend, correlation may decrease significantly.
Thus, leverage affects correlation due to its structural effect on model geometry, even with small residuals.
Before removing a high-leverage observation, consider whether the x-value is plausible and relevant to the study.
Helpful checks include:
• Confirming the data point is not a recording or data entry error.
• Assessing whether that x-value represents a meaningful subgroup or boundary case in the population.
• Determining whether excluding it would remove important information for prediction at extreme values.
A justified contextual basis is essential when deciding whether to retain such points.
Practice Questions
Question 1 (1–3 marks)
A researcher creates a scatterplot showing the relationship between hours studied (x) and exam score (y). One observation lies far to the right on the x-axis but aligns closely with the regression line.
a) Identify the statistical term used to describe this point.
b) Briefly explain why this point may affect the regression line even though it is not a y-outlier.
Question 1
a) 1 mark
• States that the point is a high-leverage point.
b) 1–2 marks
• Correctly explains that its x-value is far from the mean of x (1 mark).
• Notes that being extreme in x allows it to pull or rotate the regression line, even if its residual is small (1 mark).
Total: 2–3 marks depending on explanation quality.
Question 2 (4–6 marks)
A data set examining the relationship between daily temperature (x) and energy consumption (y) contains 25 points clustered between 5°C and 20°C, and one additional observation at 35°C.
a) Explain why the observation at 35°C is considered a high-leverage point.
b) Describe two possible effects this high-leverage point may have on the least-squares regression line.
c) State one appropriate action a statistician might take when analysing a regression model that includes a high-leverage observation.
Question 2
a) 1–2 marks
• Identifies that the point has an x-value far outside the range of most observations (1 mark).
• Explicitly states that extremity in x makes it a high-leverage point (1 mark).
b) 2–3 marks
Any two of the following, 1 mark each (up to 2 marks), plus 1 additional mark for clear elaboration:
• It may strongly influence or change the slope.
• It may shift the y-intercept.
• It may make the model appear to fit better or worse than it truly does.
• It may alter measures of fit such as correlation or r-squared.
c) 1 mark
• Suggests an appropriate action, such as inspecting the point for data entry error, analysing the model with and without the point, or considering contextual justification.
Total: 4–6 marks depending on detail and clarity.
