
AP Syllabus focus:
‘Concepts to be Covered: Analysis of influential points in regression, defined as any data point whose removal substantially alters the regression model, including significant changes to the slope, y-intercept, or correlation coefficient. The notes will include examples and discuss the implications of influential points on the regression analysis.’
Influential points matter because a single unusual observation can reshape a regression line, changing predicted values, correlation, and the story we tell about relationships entirely.
Influential Points in Regression
In a regression setting, not all data points contribute equally to the least-squares regression line. Some observations are especially powerful: if they are removed, the fitted regression model changes substantially. These observations are called influential points.
Influential point: A data point whose removal substantially changes the regression model, including noticeable changes in the slope, y-intercept, or correlation coefficient.
Influential points are not automatically “bad” data; instead, they show that the model’s conclusions depend heavily on a small portion of the data.
Key Features of Influential Points
The regression line is determined by minimizing the sum of squared residuals. An influential point usually has one or more of the following characteristics:
It has an unusual x-value, far to the left or right of most of the data.
It has a residual that is relatively large in magnitude compared with other residuals.
Its presence noticeably changes the slope, y-intercept, or correlation coefficient r.
Because of this, influential points can strongly affect predictions and the overall story a regression model tells about the relationship between two quantitative variables.
High-Leverage Points and Influence
Many influential points are related to the idea of leverage. A point has high leverage when its x-value is far from the mean of the x-values.
High-leverage point: A data point with an x-value much larger or smaller than the rest of the data, giving it a strong potential to pull the regression line toward itself.
A high-leverage point is not always influential, but it has the potential to be. Whether it is truly influential depends on how much the regression line changes when that point is included versus when it is removed.
Distinguishing Influential Points from Outliers
It is important to distinguish influential points from outliers:
An outlier in y is a point with an unusually large positive or negative residual compared with other observations.
An influential point may or may not be an outlier in y, but it often has an extreme x-value and can strongly change the fitted line.
Some outliers may have little influence on the regression line if their x-values are near the center of the data.
An effective analysis considers both how far a point is vertically from the regression line (outlier behavior) and how far it is horizontally from the bulk of the x-values (leverage).
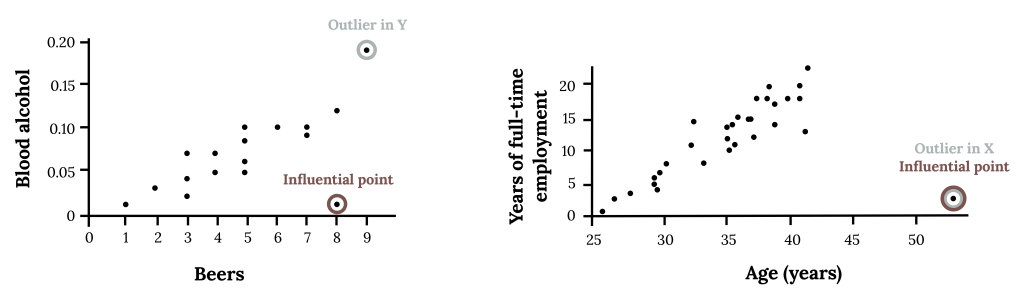
Scatterplots illustrating how an observation can be an outlier in y without being influential, and how a point that is extreme in x can be both an outlier and highly influential. The circled points show where a single observation either fits the overall trend or pulls the pattern away from the data. The real-world contexts shown exceed AP syllabus requirements but do not introduce additional statistical concepts. Source.
Detecting Influential Points in Practice
In AP Statistics, detection of influential points is usually conceptual rather than formula-based. Students rely on tools such as:
Scatterplots with regression lines to see which points lie far from the general trend, especially in the x-direction.
Regression summaries with and without a suspect point to see how much the slope, y-intercept, or correlation changes.
Conceptually, a point is considered influential when removing it leads to a clearly different linear model or a noticeably different value of r.
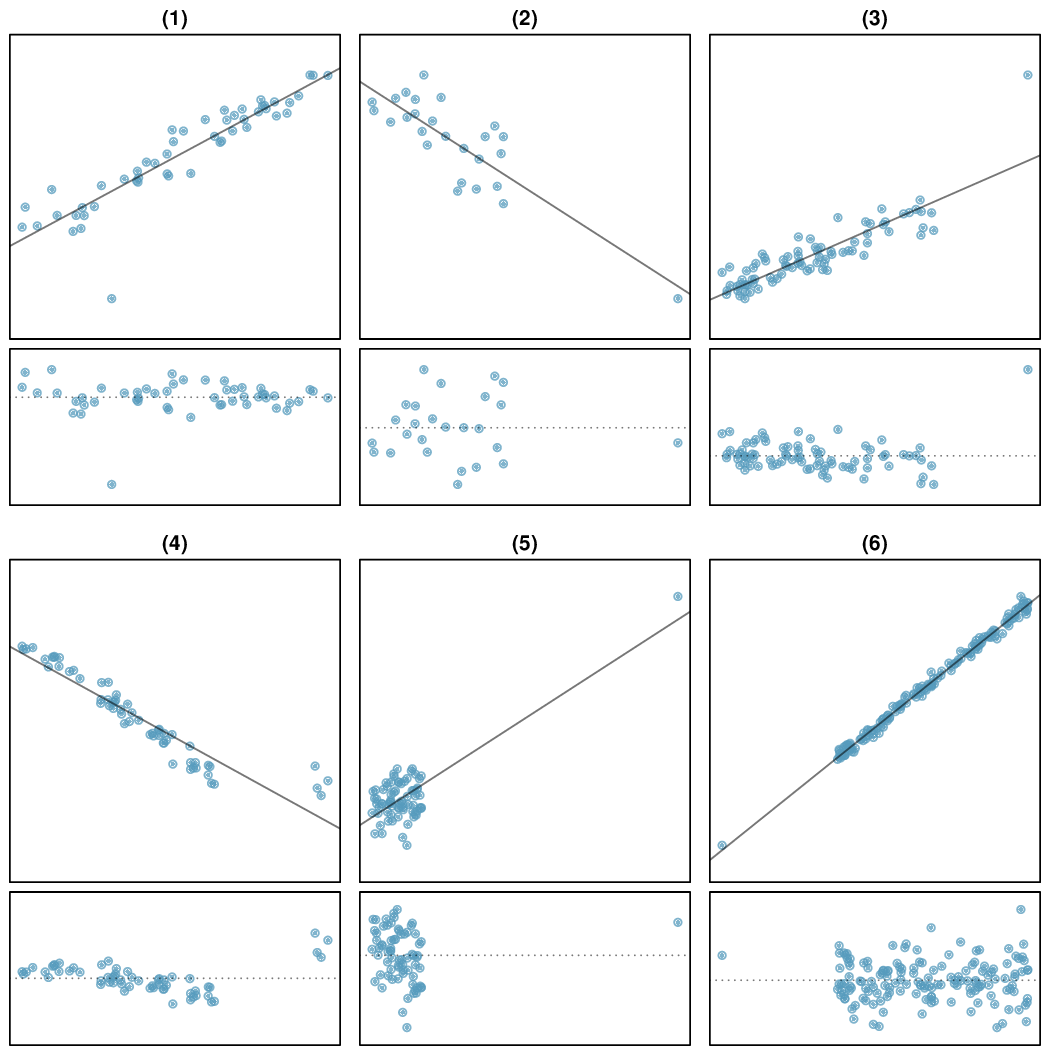
Six paired scatterplots and residual plots show how outliers and high-leverage points can change the slope of the regression line and alter the residual pattern. Panels where a distant point controls the fitted line provide clear visual evidence of influential points. The residual plots include additional detail beyond AP syllabus expectations but help illustrate how influence appears graphically. Source.
Implications of Influential Points
Influential points have important consequences for interpreting a regression model:
They can distort the slope, making the relationship appear stronger, weaker, positive, or negative compared with the pattern of most of the data.
They can shift the y-intercept, affecting predictions at x-values where no data were originally observed.
They can inflate or deflate the correlation coefficient r, giving a misleading impression of the strength of the linear association.
Because of these effects, influential points must always be examined in context. Analysts should consider whether such points represent data entry errors or measurement mistakes, unusual but valid observations, or a different subgroup or process that might be better modeled separately.
Using Context to Decide What to Do
There is no automatic rule about removing influential points. Instead, decisions should be guided by the real-world context of the data:
If an influential point results from an error, it is reasonable to correct or remove it and refit the model.
If it is a legitimate observation, it may suggest that a different model or a different subset of data should be analyzed.
When reporting results, it is helpful to describe how the regression model changes with and without influential points, emphasizing the sensitivity of conclusions.
By recognizing and carefully analyzing influential points, students can assess the reliability of regression results and avoid drawing misleading conclusions from linear models.
FAQ
Influential points tend to have greater impact on predictions at x-values closer to their own extreme x-position.
A point far to the right or left can rotate the regression line around the cluster of remaining points.
This rotation changes predicted values unevenly:
Predictions near the extreme point shift most dramatically.
Predictions near the centre of the data shift less noticeably.
Examining fitted values with and without the point highlights where predictions diverge most.
Yes, more than one influential point may appear, and their effects can combine in complex ways.
If several points lie in different extreme x-locations, each may pull the line in a different direction.
Their combined influence may:
Cancel out, producing a line that appears stable.
Reinforce one another, exaggerating a trend.
Create an unstable model highly sensitive to small changes.
Removing them one at a time helps assess individual contributions.
An influential point may represent a meaningful subgroup rather than an error.
For example, a very experienced worker or an unusually large school might follow a different relationship between variables.
In such cases:
The point is valid, but it may distort the model for the main group.
Separate models can clarify whether relationships differ for distinct subpopulations.
This approach prevents misleading conclusions based on heterogeneous data.
Yes. A point may look unusual visually but exert minimal effect on the fitted line.
This occurs when:
It lies far from the cluster horizontally but also fits exactly along the existing linear trend.
The residual is small, reducing its ability to change the slope or intercept.
Fitting models with and without the point confirms whether it truly influences parameter estimates.
The decision should balance transparency with contextual reasoning.
A clear approach includes:
Reporting results both with and without the point when it is legitimate but highly influential.
Explaining why the point is unusual and how it affects interpretations.
Justifying exclusion only if the point is demonstrably erroneous or irrelevant to the research question.
This ensures that conclusions remain honest and defensible.
Practice Questions
Question 1 (1–3 marks)
A researcher fits a least-squares regression line to a data set relating hours of study (x) to exam score (y). One observation has a much larger x-value than the rest of the data and lies close to the regression line.
(a) Explain why this point has the potential to be influential.
(b) State one reason why the point might not actually be influential in this case.
Question 1 (1–3 marks)
(a)
• 1 mark for stating that the point has a very extreme x-value / high leverage.
• 1 mark for stating that such a point can pull or alter the regression line substantially.
(b)
• 1 mark for explaining that the point may not be influential because its y-value lies close to the fitted line, resulting in a small residual / little effect on slope, intercept, or correlation.
Total: 3 marks.
Question 2 (4–6 marks)
A careers adviser collects data on years of work experience (x) and annual income (y) for a group of employees. One employee has extremely high work experience compared with the rest of the group. When the adviser removes this observation from the data set, the correlation decreases substantially and the slope of the least-squares regression line becomes noticeably flatter.
(a) Explain why this observation is considered an influential point.
(b) Describe two possible effects that including this point has on the interpretation of the relationship between experience and income.
(c) Suggest how the adviser should proceed after identifying this influential point and justify your suggestion.
Question 2 (4–6 marks)
(a)
• 1 mark for identifying that the point has an unusually large x-value (high leverage).
• 1 mark for recognising that removing it causes substantial changes in slope or correlation.
• 1 mark for concluding that these changes indicate it is influential.
(b)
Any two of the following, 1 mark each (maximum 2 marks):
• It may overstate the strength of the relationship by increasing correlation.
• It may cause the slope to appear steeper, suggesting a stronger association between experience and income.
• It may distort predictions, especially for higher experience values.
• It may misrepresent the typical pattern of the main group of employees.
(c)
• 1 mark for suggesting a correct next step, such as checking for data entry errors, investigating the context, or analysing with and without the point.
• 1 mark for justification linked to statistical reasoning, such as ensuring model validity or avoiding misleading conclusions.
Total: 6 marks.
