
AP Syllabus focus:
‘This section will delve into the significance of choosing appropriate methods for data collection, emphasizing that methods not relying on chance can lead to untrustworthy conclusions. It will outline how proper data collection methods serve as the foundation for valid statistical analysis and the role of randomness in enhancing the reliability of data collection. The discussion will include an overview of common data collection methods, highlighting their potential biases and the importance of designing methods that minimize such biases to ensure the truthfulness of the data.’
Choosing sound data collection methods is essential in statistics because trustworthy conclusions depend on randomness, representativeness, and minimizing bias, forming a reliable foundation for valid statistical reasoning.
The Role of Proper Data Collection
Reliable statistical analysis begins with appropriate data collection methods. If the data are flawed, biased, or systematically distorted, no amount of sophisticated analysis can rescue the accuracy of conclusions. In AP Statistics, recognizing how randomness supports trustworthy inference is a critical early concept. When methods rely on personal judgment or convenience instead of chance, they risk producing misleading or completely invalid results.
Why Randomness Matters
Randomness ensures that every individual in the defined population has an equal or known chance of being selected. This reduces systematic errors that occur when certain groups are consistently overrepresented or underrepresented. Without randomness, analysts cannot confidently generalize from the sample to the population because any patterns observed may reflect the sampling process rather than real characteristics of the population.
Bias: A systematic tendency for a sampling method to favor certain outcomes or responses over others, resulting in untrustworthy or misleading data.
When bias enters data collection, it undermines the entire study, making it impossible to distinguish genuine patterns from artifacts introduced by flawed methods.
Overview of Common Data Collection Methods
Different methods exist for gathering data, and each carries its own strengths, weaknesses, and susceptibility to bias. Understanding these differences enables students to evaluate whether a study’s conclusions are trustworthy, given how the data were obtained.
Sampling Methods
Random sampling is the gold standard for reducing bias, but not all sampling methods achieve this ideal.
Simple random sampling ensures every member of the population has an equal chance of selection.
Stratified sampling divides the population into groups (strata) and samples from each, improving precision.
Cluster sampling selects entire groups when populations are large or geographically spread out.
Systematic sampling chooses every kth individual from a list, which can work well unless hidden patterns exist.
Non-random methods, while sometimes convenient, significantly compromise data reliability.
Convenience Sample: A sample drawn from individuals who are easiest to access, often resulting in severe underrepresentation of key segments of the population.
Convenience sampling is widely discouraged in statistical practice because it rarely produces representative samples and often leads to strong, predictable biases.
The Importance of Method Choice
Selecting an appropriate method depends on the study goals, available resources, and the nature of the population. However, regardless of context, avoiding systematic bias must remain a priority. Using methods that rely on voluntary participation, personal judgment, or accessibility rather than chance introduces distortions that cannot be corrected after the fact.
Bias and Its Impact on Trustworthiness
Bias threatens the “truthfulness” of data by systematically distorting the sample. When certain groups are more likely than others to respond or participate, the sample no longer reflects the population accurately. This results in misleading estimates, exaggerated patterns, or false conclusions.
Sources of Bias in Data Collection
AP Statistics emphasizes common sources of bias that stem from poorly chosen data collection methods.
Voluntary response bias arises when individuals choose to participate, often attracting those with strong opinions.
Undercoverage occurs when parts of the population have no chance of being included.
Response bias develops when question wording, interviewer influence, or inaccurate self-reporting distorts results.
Nonresponse bias appears when selected individuals do not participate despite being chosen through a random process.
Recognizing these problems allows students to scrutinize study designs and identify where improvements could be made.
Sampling Variability: The natural variation that occurs between different random samples drawn from the same population, even when methods are unbiased.
Sampling variability is expected and manageable; bias is not. Randomness helps ensure that variability does not systematically push results in one direction.
Building Reliable Statistical Foundations
Because statistical inference depends on the assumption that data reflect the population accurately, proper data collection serves as the foundation for every study. When randomness guides the process, and when methods are designed to minimize bias, statisticians can generalize findings with confidence. This aligns directly with the syllabus emphasis that non-random methods lead to untrustworthy conclusions and that rigorous, unbiased data collection enhances the reliability and credibility of statistical results.
Understanding the importance of data collection methods equips AP Statistics students to evaluate studies critically, select appropriate methodologies, and appreciate how randomness safeguards the truthfulness of data.
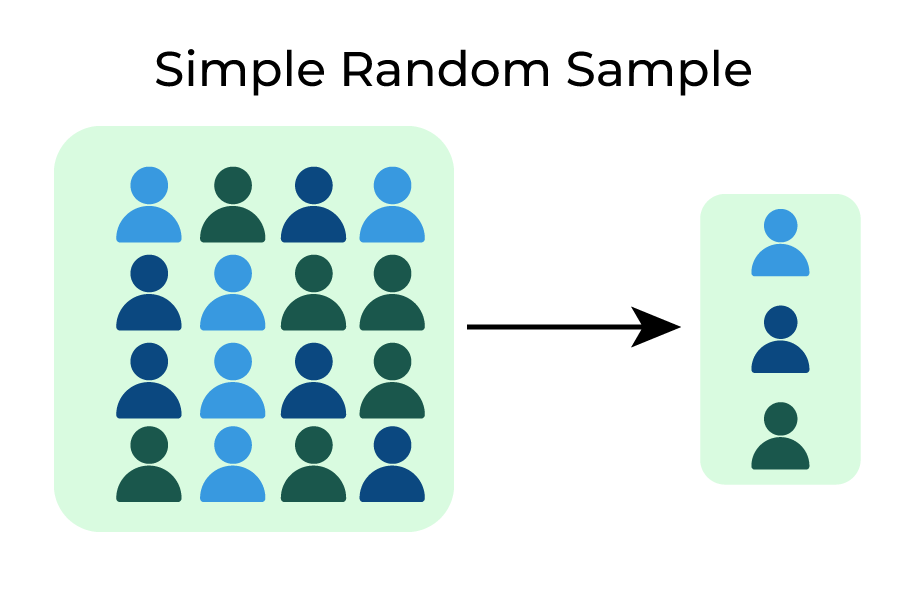
This figure depicts a simple random sample taken from a larger population, illustrating that each individual is equally likely to be selected. The layout emphasizes chance-based selection rather than convenience or judgment. Extra details presented in the surrounding article are not required for the AP Statistics syllabus. Source.
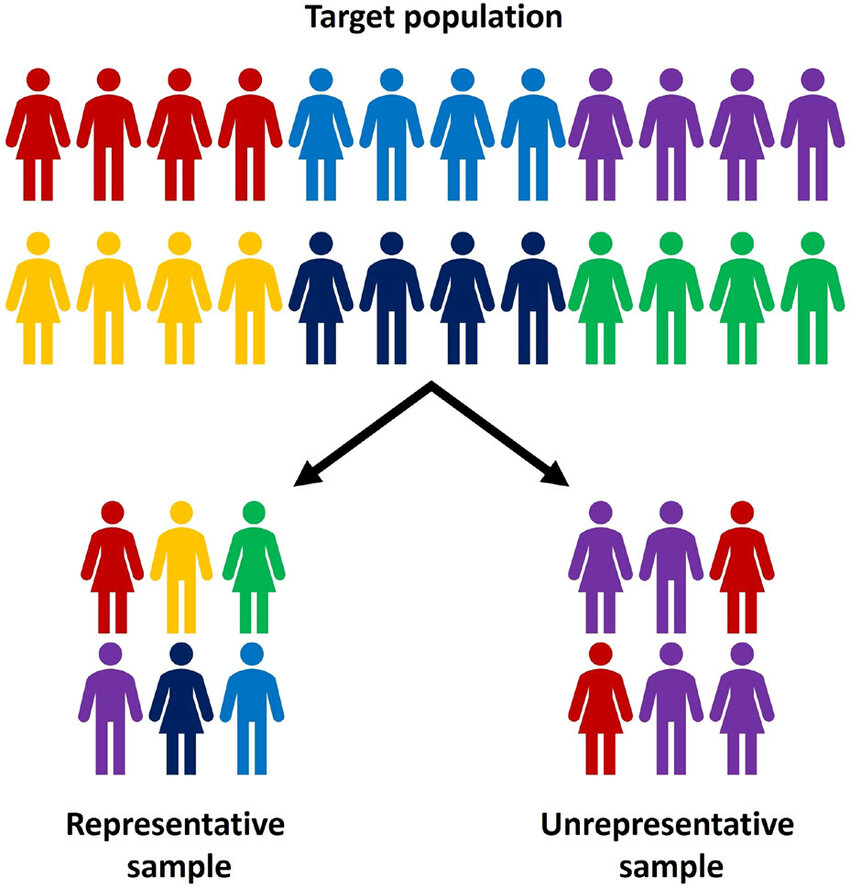
This diagram contrasts a representative sample with an unrepresentative one, highlighting how biased selection alters the composition of the sample. The visual directly illustrates why unrepresentative data lead to distorted or untrustworthy results. Although created for machine-learning contexts, its depiction of representativeness aligns fully with AP Statistics concepts. Source.
FAQ
Poor data collection embeds systematic errors into the dataset from the very beginning. Once those errors are present, even the most advanced or appropriate statistical methods cannot correct them.
These flaws can lead to misleading patterns that appear meaningful but actually reflect how the data were gathered. As a result, the validity of the entire investigation may be compromised before analysis begins.
Randomness protects against subconscious preferences, convenience-based decisions, and predictable human tendencies that skew the sample.
Researcher judgement may unintentionally favour certain types of individuals. Random procedures eliminate that subjectivity, giving each member of the population a fair chance of selection.
A small random sample can still be unbiased, but it will display greater variability. This means different small samples from the same population may produce noticeably different results.
Larger random samples reduce this variability, making estimates more stable and trustworthy. However, randomness remains more important than size in avoiding systematic bias.
A method is prone to bias if it limits access to certain groups or relies on self-selection.
Typical features include:
• Dependence on volunteers
• Sampling based on convenience or proximity
• Exclusion of harder-to-reach population segments
• Allowing participants to opt in or opt out in a predictable way
Invitations containing emotional language, strong opinions, or leading phrasing can attract respondents with particular attitudes, creating self-selection pressure.
Neutral, factual wording helps avoid signalling a preferred type of participant. This reduces the chance that only enthusiastic, concerned, or ideologically driven individuals choose to respond, thereby supporting a more balanced sample.
Practice Questions
Question 1 (1–3 marks)
A researcher posts a survey link on a popular social media site and invites anyone interested to participate.
a) Identify the type of sampling method being used.
b) State one reason why this method may lead to untrustworthy conclusions about the population.
Question 1 (1–3 marks)
a) 1 mark
• Correctly identifies the method as voluntary response sampling or self-selected sampling.
b) 1–2 marks
• States a valid reason for untrustworthy conclusions, such as:
– People who choose to respond may differ systematically from the population (1 mark).
– Only highly motivated or opinionated individuals may participate, reducing representativeness (1 mark).
Maximum: 3 marks.
Question 2 (4–6 marks)
A school wants to estimate the proportion of its students who regularly skip breakfast. The headteacher instructs teachers to distribute a questionnaire only to students who arrive early for morning registration.
a) Explain why this data collection method may not produce a representative sample.
b) Identify and describe the type of bias most likely to occur.
c) Propose one improvement to the data collection procedure that would strengthen the reliability of the findings, explaining why it is effective.
Question 2 (4–6 marks)
a) 1–2 marks
• Explains that only students who arrive early are included (1 mark).
• Notes that these students may differ from the overall student body, leading to an unrepresentative sample (1 mark).
b) 1–2 marks
• Identifies undercoverage bias or selection bias (1 mark).
• Describes how late-arriving students are excluded and may have different breakfast habits (1 mark).
c) 2 marks
• Suggests an improved method such as random sampling from the whole student list, distributing questionnaires to all students, or sampling across different times of day (1 mark).
• Clearly explains why the method reduces bias or increases representativeness (1 mark).
Maximum: 6 marks.
