
AP Syllabus focus:
‘Exploration of undercoverage bias, where part of the population has a reduced chance of inclusion in the sample, making the sample unrepresentative of the overall population. This section will address the causes, consequences, and methods to minimize undercoverage bias.’
In AP Statistics, recognizing undercoverage bias is essential. When parts of a population are missed, conclusions can be seriously misleading, overstating or understating important patterns.
Undercoverage Bias: Core Idea
In any study, we want a sample that accurately reflects the population of interest.
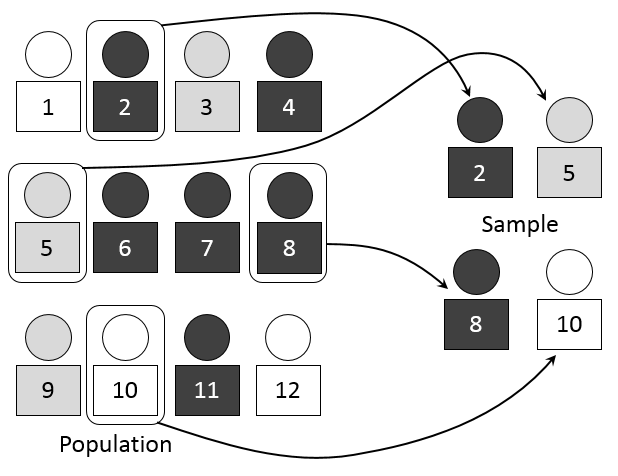
This diagram shows a population of individuals and highlights a simple random sample chosen from it. In a simple random sample, every individual has an equal chance of selection, supporting unbiased sampling. Comparing this ideal to real study designs highlights how undercoverage occurs when some individuals never have a chance of being selected. Source.
Undercoverage bias occurs when some members of the population have a much lower chance of being included in the sample than others.
Undercoverage Bias: A type of sampling bias that arises when part of the population has a reduced or zero chance of being selected, so the sample does not represent the entire population.
Undercoverage is especially problematic because it is often invisible: you only see the data from people who were reachable, not from those who were left out.
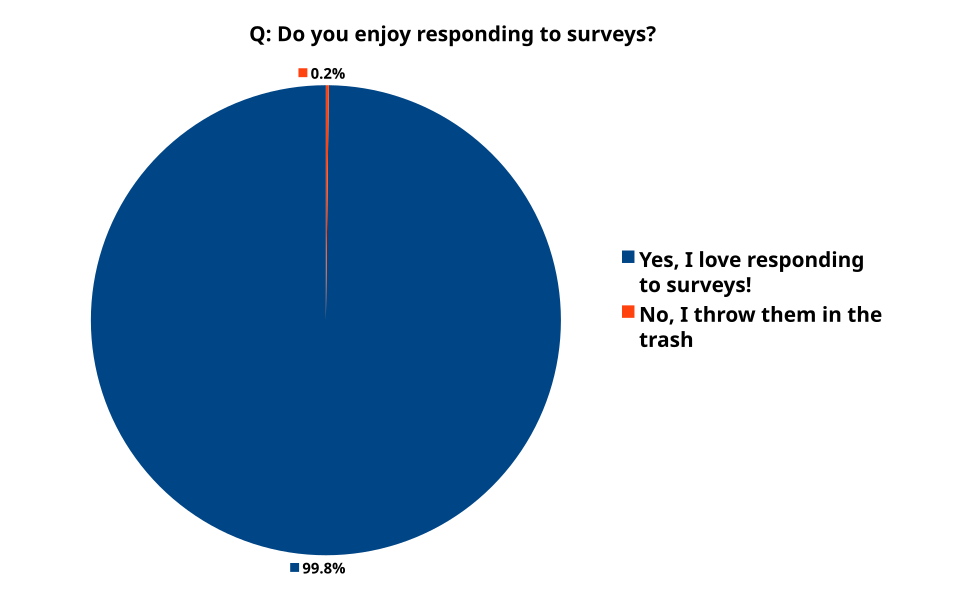
This illustration shows a survey answered only by people who like taking surveys, while others are excluded. It demonstrates how self-selection can create a form of undercoverage by omitting certain perspectives. Extra humorous details appear but all reinforce the idea of sampling bias caused by limited inclusion. Source.
Relationship to Populations, Samples, and Sampling Frames
A population is the entire group you want to study, while a sample is the subset you actually collect data from. To obtain the sample, you usually rely on a sampling frame, the list or process from which you select individuals. Undercoverage bias arises when the sampling frame does not fully match the population.
Common situations that produce undercoverage include:
Using a phone list that omits households without phones or with unlisted numbers.
Conducting an online survey that only reaches people with reliable internet access.
Surveying students only during a particular class period, missing students who are absent or in different programs.
Sampling from a membership list that excludes people who are new, inactive, or not formally registered.
Causes of Undercoverage Bias
Undercoverage usually results from how the data collection method is designed, not from the behavior of individuals after they are selected. Major causes include:
Incomplete sampling frames: Some population members are never listed or accessible.
Geographic or time restrictions: Data are collected only in certain locations or at certain times, missing groups who are elsewhere or unavailable.
Technology barriers: Reliance on specific technologies (like smartphones or social media) excludes people who do not use them.
Eligibility rules that are too narrow: Criteria accidentally exclude groups who are still part of the real population of interest.
Consequences for Statistical Conclusions
Undercoverage threatens the goal of obtaining a representative sample. When certain groups are underrepresented, estimates of population quantities (such as means, proportions, or differences between groups) can be systematically too high or too low.
Key consequences include:
Biased estimates of attitudes, behaviors, or characteristics.
Distorted comparisons between subgroups if some groups are undercovered more than others.
Overconfidence in conclusions because standard statistical formulas may assume random sampling from the full population, which is not actually true.
Recognizing Undercoverage in Study Designs
Before collecting data, it is important to ask: “Who is in my sampling frame, and who might be missing?” Signs of possible undercoverage include:
A sampling frame that clearly omits known segments of the population.
A mode of data collection that only reaches certain demographic or socioeconomic groups.
Study logistics that systematically exclude certain schedules, locations, or institutions.
During or after data collection, you might notice undercoverage if:
Certain groups you know exist in the population barely appear in the sample.
The sample’s composition differs sharply from trusted population information (such as census data) in predictable ways.
Strategies to Minimize Undercoverage Bias
Although it is difficult to eliminate undercoverage completely, careful planning can greatly reduce it. Useful strategies include:
Improving the sampling frame: Combine multiple lists or sources to cover more of the population.
Using multiple contact modes: Mix mail, phone, online, and in-person approaches to reach people with different access and preferences.
Extending coverage in time and space: Collect data at varied times and locations to include people with different schedules or living situations.
Clarifying the target population: Define clearly who should be included, then design sampling methods that reach all such individuals as directly as possible.
Pilot testing the design: Try out the sampling method on a small scale to identify who is being missed and adjust accordingly.
Connection to Overall Data Quality
Undercoverage bias is one of several ways that data collection methods can go wrong, but it directly reflects the syllabus emphasis on causes, consequences, and methods to minimize this problem. Because chance-based methods can only correct for random variation, not for missing segments of the population, reducing undercoverage at the design stage is essential for trustworthy, truth-telling data in AP Statistics.
FAQ
Undercoverage bias occurs when certain members of the population are never included in the sampling frame or have almost no chance of being selected.
Nonresponse bias occurs only after individuals have been selected, when they choose not to participate or cannot be reached.
Although both lead to unrepresentative samples, undercoverage happens before data collection, while nonresponse happens during the data collection process.
Researchers can compare the sample’s characteristics with known population benchmarks, such as census data or institutional records.
They can also examine patterns in who was reachable and identify systematic gaps, such as the absence of certain age groups or geographic areas.
Pilot studies and small-scale test samples can further reveal groups that are consistently missed.
Weighting can sometimes reduce the effects of undercoverage, but it cannot fully correct for groups that were never sampled at all.
Weighting works best when:
The undercovered group is small.
There is reliable external information describing the true population distribution.
The characteristics of missing individuals can be inferred from related variables.
If an entire subgroup is absent, weighting cannot recover information that was never collected.
Rapidly changing populations have shifting demographics, mobility patterns, or membership lists, making sampling frames become outdated quickly.
Groups such as recent migrants, new residents, or people with unstable housing may be systematically excluded.
Because the population changes faster than the sampling frame can be updated, undercoverage can increase over time, reducing the accuracy of any estimates.
Different data collection modes reach different segments of the population, so a single mode can inadvertently exclude certain groups.
For example:
Online surveys miss individuals without stable internet access.
Phone surveys exclude those without up-to-date phone numbers.
In-person surveys may miss people with limited mobility or irregular attendance.
Using mixed-mode approaches can reduce these gaps by allowing more equal access to participation.
Practice Questions
Question 1 (1–3 marks)
A researcher conducts an online survey about spending habits using a website that requires users to register with a credit card. Explain why this sampling method may lead to undercoverage bias.
Question 1 (1–3 marks)
1 mark: States that some groups are excluded or have a lower chance of being selected.
1 mark: Identifies who is undercovered (e.g., people without credit cards, people who avoid online payments, younger individuals).
1 mark: Explains that the sample will not represent the full population, leading to biased results.
Question 2 (4–6 marks)
A school wants to estimate the proportion of students who regularly eat breakfast before classes. The school distributes a questionnaire only to students who arrive before 8:00 a.m.
a) Identify the type of bias present in this study.
b) Explain in detail how this bias might affect the findings.
c) Suggest one improvement to the data collection method that would reduce undercoverage bias and justify why it is effective.
Question 2 (4–6 marks)
Part (a) (1 mark): Correctly identifies undercoverage bias.
Part (b) (2–3 marks):
1 mark: Explains that students arriving after 8:00 a.m. are excluded or have a reduced chance of being included.
1 mark: Explains how these students may differ systematically from early arrivals (e.g., late sleepers may have different breakfast habits).
1 further mark for a clear explanation of how this difference leads to biased estimates of the true proportion.
Part (c) (1–2 marks):
1 mark: Suggests a valid method to reduce undercoverage (e.g., surveying all students during form time, using multiple time points, or distributing surveys in all classes).
1 additional mark: Provides a justified explanation of how this method ensures all or more students have an equal chance of being included.
