
AP Syllabus focus:
‘Detailed analysis of confounding variables, which are related both to the explanatory variable and the response variable, potentially creating a false perception of association. Strategies for controlling confounding variables to ensure the validity of experimental outcomes will be discussed.’
Confounding variables threaten the validity of experimental results by obscuring true relationships. Understanding how to identify and control them is essential for producing trustworthy, unbiased conclusions in statistical investigations.
Understanding Confounding Variables
A confounding variable is any additional variable that is related to both the explanatory variable and the response variable, creating the illusion of a cause-and-effect relationship where none may exist. When confounding is present, it becomes unclear whether observed differences in outcomes are due to the treatment or to the confounder.
Confounding Variable: A variable associated with both the explanatory and response variables, which can distort or mask the true relationship being investigated.
Confounding threatens internal validity, meaning the degree to which an experiment accurately establishes causal links. Without addressing confounding, even carefully designed studies may produce misleading or biased conclusions.
Why Confounding Occurs
Confounding arises when the explanatory variable differs across groups in ways other than the intended treatment. This often happens due to:
Non-random assignment, where treatments are applied systematically rather than by chance.
Pre-existing differences among participants that influence outcomes.
Environmental factors, such as time of day or location, that vary between treatment groups.
Researcher or participant behavior, which unintentionally introduces systematic differences.
These influences can create false associations, making treatments appear to have effects they do not truly possess or masking real effects.
Identifying Potential Confounding Variables
Recognizing confounders requires examining the relationships among variables before and during an experiment. Indicators include:
A variable that predicts the response regardless of treatment.
A variable distributed unevenly across treatment groups.
A factor suspected to influence outcomes based on scientific or contextual reasoning.
Researchers often analyze designs for source of bias by reflecting on what traits participants bring with them or what uncontrolled factors might systematically differ.
Key Questions for Identifying Confounders
Is there a variable other than the treatment that might influence the outcome?
Does the distribution of this variable differ across treatment groups?
Could this variable explain the observed differences in responses?
Confounding variables can create a false perception of association between a treatment and an outcome by being related to both the explanatory variable and the response variable.
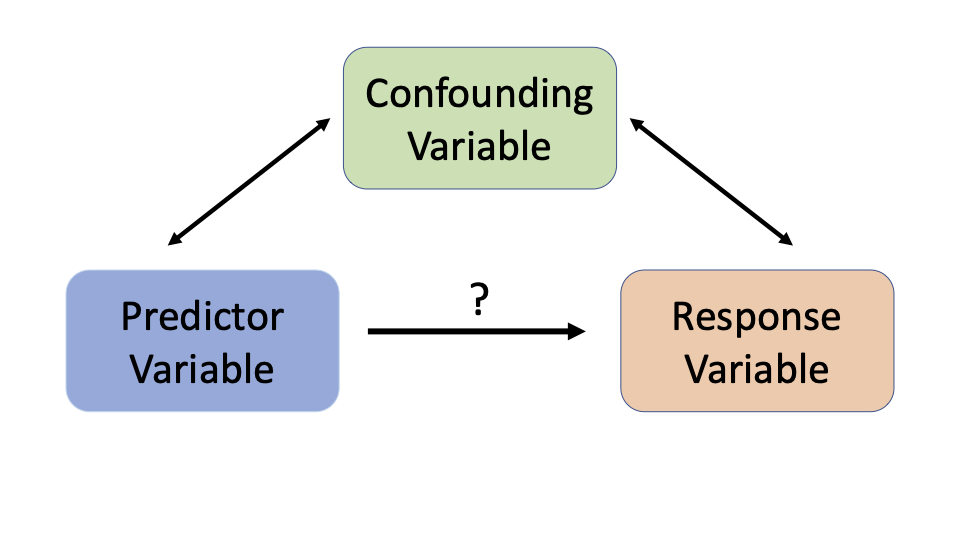
Diagram showing how a confounding variable simultaneously affects the explanatory and response variables, potentially creating a misleading relationship. The arrows emphasize that the confounder is associated with both, reinforcing the concept used in experimental design. This visual directly supports the definition of confounding in AP Statistics. Source.
Strategies for Controlling Confounding Variables
To ensure the validity of experimental outcomes, researchers use several methods to reduce or eliminate the influence of confounders.
1. Random Assignment
Random assignment distributes potential confounding variables evenly, both known and unknown, across treatment groups.
This method ensures that differences among individuals are spread by chance rather than design, helping isolate the effect of the explanatory variable.
Random Assignment: The process of assigning experimental units to treatments using a chance mechanism so that groups are comparable.
Random assignment is the most powerful tool for controlling confounding because it does not require identifying every possible confounder in advance.
2. Holding Variables Constant
Some sources of variability can be controlled by making conditions identical for all subjects except for the treatment itself. This may include:
Testing participants at the same time of day
Using identical equipment or environments
Ensuring equal instructions or researcher interactions
This method eliminates variability due to the controlled factor but may limit generalizability if conditions are artificially narrow.
3. Blocking
Blocking groups experimental units based on a variable expected to influence the response. Treatments are then randomly assigned within each block.
Blocking: Organizing subjects into groups based on a variable that is expected to affect the response, then applying treatments randomly within each group.
Blocking directly addresses confounders by ensuring treatment groups are compared only within similar subsets.
4. Matching
In studies involving individuals, researchers may match subjects on key characteristics so each treatment group has participants with comparable traits.
Examples include matching based on age, educational background, or baseline performance.
Matching is particularly valuable in paired designs, where each subject in one treatment group is paired with a similar participant in another.
5. Using Control Groups
A control group provides a baseline to compare treatment effects. By holding conditions constant except for the treatment, control groups help reveal whether observed differences are related to the treatment or to external confounding factors.
6. Blinding
Blinding reduces the risk of confounding from participant or researcher expectations.
Single-blind: Participants do not know which treatment they receive.
Double-blind: Neither participants nor researchers know treatment assignments.
Blinding minimizes behavior-based confounding variables.
If confounding variables are not identified and controlled, the resulting association can be misleading or even reverse direction when different groups are combined.
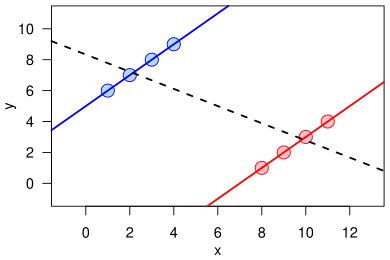
Scatterplot illustrating Simpson’s paradox, where each colored group shows a positive trend while the combined data show a negative trend. The reversal demonstrates how ignoring a confounding grouping variable can distort the apparent relationship. This image extends the confounding concept by showing its impact on statistical associations. Source.
Evaluating Control Measures
After implementing control techniques, researchers must assess whether they successfully reduced confounding. Indicators include:
Comparable distributions of key characteristics across groups
Balanced variability among conditions
Clearer attribution of differences to the treatment
Effective confounding control strengthens causal interpretation, which is a central goal of well-designed experiments.
FAQ
A confounding variable is specifically associated with both the explanatory and response variables within the context of the study design, making it difficult to determine which variable is actually influencing the outcome.
A lurking variable is not included or measured in the study at all but still has the potential to influence the relationship between the variables.
While all confounders are lurking variables in the sense that they interfere with interpretation, not all lurking variables necessarily meet the criteria to confound.
Yes. A variable may not initially appear associated with the explanatory variable, but changes in study circumstances or participant behaviour can create associations later.
For example, if participants drop out of one treatment group more than another, factors associated with dropout can become confounders.
This is why continuous monitoring of study execution is essential in long-running experiments.
Over-controlling can reduce the variability necessary to detect genuine treatment effects. If too many factors are held constant, the experiment may become artificial and lack ecological validity.
Additionally, excessive control can introduce logistical and ethical challenges, increasing cost and participant burden.
Effective confounding control balances rigour with practicality, focusing on the variables most likely to influence outcomes.
Researchers prioritise variables based on:
Strength of their known relationship with the response.
Likelihood of differing across treatment groups.
Practical feasibility of forming meaningful blocks.
Blocking is most beneficial when the variable has a large, predictable effect on outcomes. Minor or unpredictable variables typically do not justify the added complexity of blocking.
Yes, although random assignment greatly reduces the risk, chance imbalances can still occur, especially with small sample sizes.
Randomisation reduces systematic bias but does not guarantee perfectly equal distributions of all variables.
Post-randomisation checks such as comparing baseline characteristics help researchers identify potential imbalances and decide whether additional adjustments are needed.
Practice Questions
Question 1 (1–3 marks)
A researcher wants to test whether a new revision programme improves examination performance. Students choose for themselves whether to use the new programme or continue with their usual study methods.
Explain why confounding variables may affect the conclusions of this study.
Question 1 (1–3 marks)
Award up to 3 marks:
1 mark for stating that confounding variables are factors related to both the choice of study method and exam performance.
1 mark for noting that students self-selecting their study method may differ in motivation, ability, or time availability.
1 mark for explaining that these differences may falsely appear as an effect of the revision programme, leading to invalid conclusions.
Question 2 (4–6 marks)
A school investigates whether a new breakfast scheme improves concentration levels in morning lessons. Students are randomly selected to participate, but due to timetable differences, all Year 10 pupils receive the breakfast scheme while all Year 11 pupils do not.
(a) Identify one potential confounding variable in this design and justify your choice.
(b) Explain how this confounding variable could affect the interpretation of the results.
(c) Describe one method the school could use to control for this confounding variable in a revised experimental design.
Question 2 (4–6 marks)
Award up to 6 marks:
(a)
1 mark for correctly identifying a confounding variable, e.g. year group, age, curriculum level, or exam difficulty.
1 mark for justifying that this variable is related to both treatment allocation and concentration levels.
(b)
1 mark for explaining that differences in maturity, academic pressure, or subject difficulty between Year 10 and Year 11 could influence concentration independently of the breakfast scheme.
1 mark for explaining that any observed difference might therefore be wrongly attributed to the breakfast scheme.
(c)
1 mark for describing a valid method of control, such as random assignment within each year group (blocking), matching students, or ensuring both year groups are represented in each treatment.
1 mark for explaining how this method would reduce or eliminate the confounding effect.
