
AP Syllabus focus:
‘Enduring Understanding: VAR-3 underscores that well-designed experiments are pivotal for establishing causal relationships. This subsubtopic introduces the concept of statistical inference, emphasizing its role in drawing conclusions from data to the broader distribution. It covers the foundational understanding that statistical inference allows researchers to attribute observed results to the population from which the data were drawn.’
Statistical inference enables researchers to use sample data to make reasoned conclusions about a larger population, relying on randomness and probability to justify those conclusions.
Understanding Statistical Inference
Statistical inference is the process of using data from a sample to reach conclusions about a population, allowing researchers to move beyond what was directly observed. Because it is rarely feasible to collect data from every member of a population, inference provides a principled method for generalizing results when appropriate. It is grounded in probability, which explains how likely it is that a sample result reflects the true characteristics of the population.
When introducing inference, AP Statistics emphasizes the importance of well-designed experiments, particularly those using random assignment, because they strengthen the ability to establish causal relationships. Statistical inference depends on both the structure of the study and the quality of the data collected. Proper use of inference helps distinguish between patterns that are meaningful and those that arise from natural variability.
Key Components of Statistical Inference
Before applying inference, it is essential to understand the relationship between the sample and the population, as well as the mechanisms that justify inference.
Population: The entire group of individuals or cases about which conclusions are desired.
A population is always defined by the purpose of a study, and clear definition ensures that the inference made from a sample meaningfully aligns with the broader group of interest.
After identifying the population, researchers draw a sample and compute statistics from it. These statistics serve as the basis for inference, guiding judgments about population parameters.
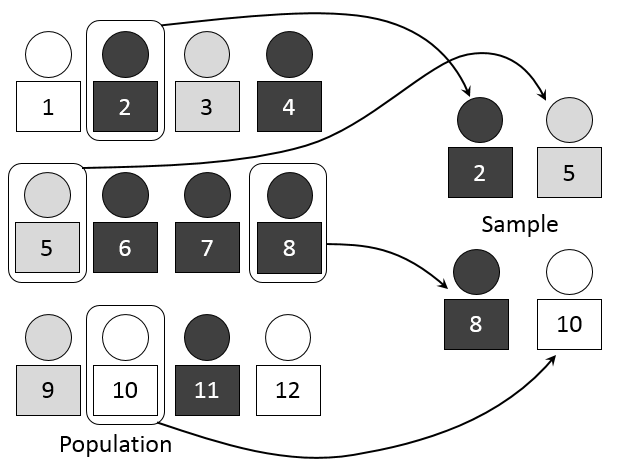
This diagram illustrates a population from which a simple random sample is drawn using chance-based selection. It highlights the principle that every individual has an equal chance of inclusion, reinforcing the foundations of statistical inference. The visual stays within AP Statistics expectations without introducing advanced techniques. Source.
Parameter: A numerical value that describes a characteristic of a population, such as a mean or proportion.
Because parameters are unknown, inference uses sample statistics to estimate them or to test claims about them.
The Role of Randomness in Inference
Randomness is the central pillar that justifies statistical inference. A sample selected using chance-based methods is more likely to be representative, reducing systematic biases. These chance procedures create predictable long-run patterns described by probability, which allows researchers to quantify uncertainty in their conclusions.
Inference commonly addresses two broad goals:
• Estimation, where the task is to approximate a population parameter.
• Hypothesis testing, where researchers evaluate the strength of evidence for or against a particular claim.
Both rely on understanding sampling variability—the natural fluctuations that arise from sample to sample. When randomness governs sample selection or treatment assignment, this variability can be modeled, making inference valid.
Sampling Variability and the Logic of Inference
Because every random sample differs, the statistics calculated from samples also vary. This phenomenon is known as sampling variability, and it is the reason probability plays such a substantial role in inference. By understanding how statistics behave across hypothetical repeated samples, researchers can determine whether an observed effect is likely due to chance or reflects a true underlying pattern.
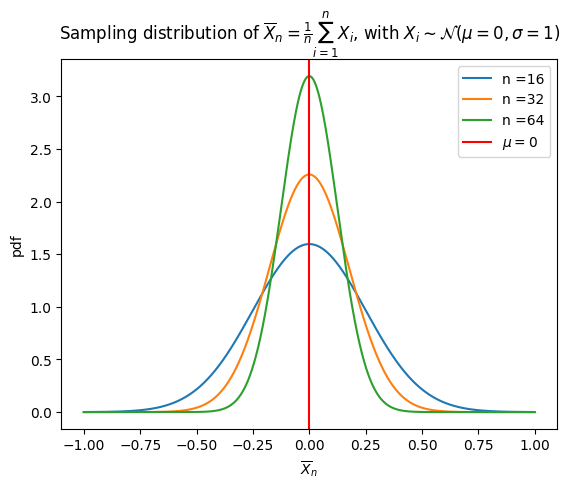
This plot shows sampling distributions of the sample mean for several sample sizes. As sample size increases, variability decreases, producing narrower curves that strengthen inferential conclusions. The mathematical notation in the title slightly exceeds AP requirements but remains conceptually aligned. Source.
EQUATION
= True population proportion
The concept of a sampling distribution provides the theoretical foundation that supports inferential statements.
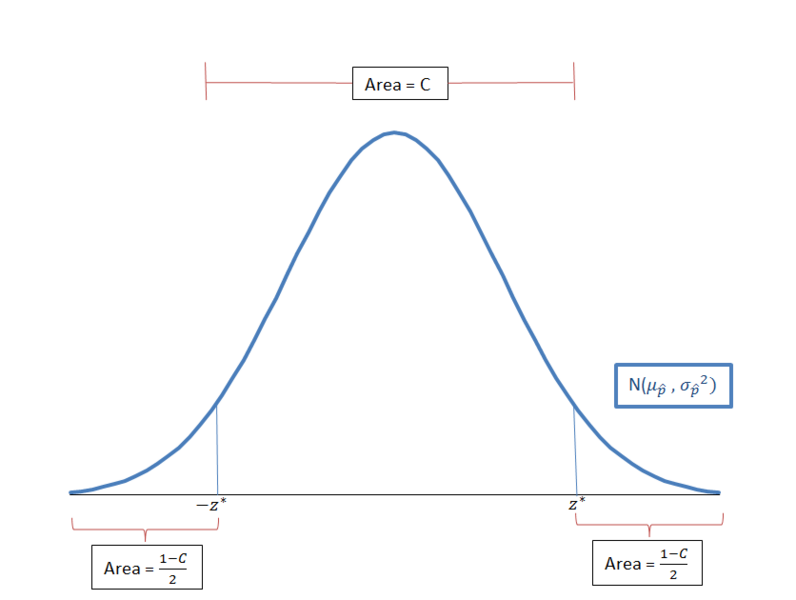
This image shows a normal-shaped sampling distribution centered at the population proportion. It emphasizes that most sample proportions cluster near the center while extremes become less likely, supporting the logic of identifying unusual results. Its focus on proportions is consistent with AP Statistics expectations. Source.
Following any equation block, clear connections must be made to the broader logic of inference. Sampling distributions allow researchers to assess unusual or extreme outcomes, which is central to determining whether observed results suggest meaningful patterns in the population.
Inference and Causal Relationships in Experiments
Central to the syllabus statement for this subsubtopic is that well-designed experiments—particularly those using random assignment—are crucial for making causal claims. Unlike observational studies, experiments allow researchers to control conditions and isolate the effect of a treatment.
Random assignment distributes potential confounding variables evenly across treatment groups, making differences in outcomes more credibly attributed to the treatments rather than external influences. This connection between design and inference ensures that conclusions drawn from experimental data are not merely descriptive but provide evidence for cause-and-effect relationships.
Conditions Supporting Valid Inference
AP Statistics emphasizes several conditions that must be met for statistical inference to be credible:
• Random selection or random assignment, ensuring that probability reasoning applies.
• Representative samples, enabling generalization to the relevant population.
• Sufficient sample size, minimizing the impact of variability.
• Appropriate study design, ensuring alignment between research goals and inferential claims.
These conditions reinforce why careful planning and rigorous methodology are necessary before any inferential tools are applied. Statistical inference is not simply a set of procedures but a framework for understanding uncertainty and making justified statements about populations based on sample data.
FAQ
Descriptive statistics summarise what happened in the sample without extending beyond it. Statistical inference uses probability to make statements about the wider population that the sample represents.
Inference therefore includes an element of uncertainty. It evaluates how plausible it is that observed patterns reflect true population behaviour rather than random chance.
Probability quantifies how likely different sample outcomes are under repeated random sampling. This allows researchers to judge whether an observed result is typical or unusual.
Without probability, there is no formal way to distinguish meaningful results from natural fluctuations that arise purely by chance.
Trustworthy samples arise from chance-based selection methods. These reduce systematic biases and increase representativeness.
Less reliable samples often result from convenience, self-selection, or inconsistent inclusion criteria. Such samples can distort the link between the sample and the population, weakening inferential conclusions.
Inference is built on the assumption that repeated random samples would follow predictable long-run behaviour. This imagined repetition forms the basis for constructing sampling distributions.
These long-run patterns help determine whether an observed statistic is an expected outcome or one that indicates meaningful population differences.
Inference about cause-and-effect can still be made if random assignment was used in an experiment, even without random sampling.
However, generalising results to a wider population is much more limited. Without random sampling, the study may not provide strong evidence that the sample represents the broader group of interest.
Practice Questions
(1–3 marks)
A researcher selects a random sample of 80 university students to estimate the proportion of all university students who regularly cycle to campus.
Explain why statistical inference is appropriate in this situation.
(1–3 marks)
• 1 mark for stating that a sample is being used to draw conclusions about a wider population.
• 1 mark for recognising that randomness in selection justifies generalisation.
• 1 mark for explaining that inference allows estimation of an unknown population proportion based on the sample.
(4–6 marks)
A well-designed experiment is conducted to investigate whether a new teaching method improves exam performance. Students are randomly assigned to either the new method or the standard method. After the exam, the mean scores of the two groups are compared.
(a) Explain why random assignment is essential for drawing a causal conclusion.
(b) Describe how sampling variability affects the interpretation of the difference in mean scores.
(c) State one condition needed for valid statistical inference in this context and explain why it is necessary.
(4–6 marks)
(a)
• 1 mark for stating that random assignment distributes confounding variables evenly across groups.
• 1 mark for stating that this allows differences in outcomes to be attributed to the treatment rather than other factors.
(b)
• 1 mark for identifying that sample means vary naturally from sample to sample.
• 1 mark for explaining that an observed difference may arise from this variability rather than a true effect.
(c)
• 1 mark for correctly stating a condition such as adequate sample size, representative experimental units, or proper random assignment.
• 1 mark for explaining how this condition ensures that inference is valid (for example, reduces bias, ensures probability reasoning applies, or allows generalisation).
