
AP Syllabus focus:
‘Explains simulation as a method to model random events, ensuring that simulated outcomes closely resemble real-world outcomes. Detail how all possible outcomes are associated with values determined by chance, including the method for recording counts of simulated outcomes and total counts.’
Simulation provides a structured way to model random events so that their behavior can be studied, estimated, and understood when real-world experimentation is impractical or impossible.
Understanding the Purpose of Simulation
Simulation is a fundamental statistical tool used to reproduce the behavior of random processes in a controlled, repeatable manner. In AP Statistics, simulations allow students to explore how chance mechanisms operate, observe patterns generated by random behavior, and estimate probabilities through repeated trials that mimic real conditions. A simulation reflects the core idea that chance drives outcomes and that careful modeling helps reveal long-run tendencies within unpredictable systems.
Modeling Random Events
A random event refers to an occurrence generated by a process determined by chance. Simulation aims to mirror the real-world likelihood of such events by constructing a model that accurately represents all possible outcomes and their associated probabilities. Because randomness is central to probability theory, simulations must be designed so that the mechanism used—whether a random number generator, coin, die, or computational tool—faithfully reproduces the chance behavior being studied.
Ensuring Simulated Outcomes Resemble Real-World Outcomes
To adhere to the AP specification requirement that simulations “closely resemble real-world outcomes,” the constructed simulation must satisfy two key criteria:
The simulation’s structure must match the probability model of the real context.
Each simulated result must be generated by a mechanism that behaves according to the same underlying chance rules as the actual scenario.
This fidelity ensures that conclusions drawn from the simulated data meaningfully approximate what would happen in repeated real-world trials.
When the model is appropriate and the random mechanism is fair, the pattern of simulated outcomes will mirror the long-run behavior of the real-world chance process more and more closely.

Random points generated within a square containing a circle illustrate how repeated chance-based trials approximate an underlying probability. Although this example estimates π, it demonstrates the core simulation principle: long-run relative frequency approaches a theoretical value. The added detail about π exceeds syllabus needs but does not hinder understanding of simulation fundamentals. Source.
Associating Outcomes With Chance-Determined Values
Every simulation relies on associating each possible outcome with a numerical or symbolic representation. This assignment is crucial because it links the random mechanism to the event being modeled. When a simulation uses a random number generator, for instance, the numbers must correspond clearly and consistently to the possible outcomes of the scenario.
Outcome: The result of a single repetition (trial) of a random process.
A simulation must identify all outcomes that could occur so that each can be properly represented. This ensures that the simulation neither omits possible results nor includes impossible ones.
After establishing outcomes, the next step is assigning values determined by chance to each outcome—often in the form of random digits or intervals of random digits. This mapping ensures that every outcome’s likelihood within the simulation matches its true probability.
A table of random digits or computer-generated random numbers is often used because each digit 0–9 is equally likely and independent of the others.
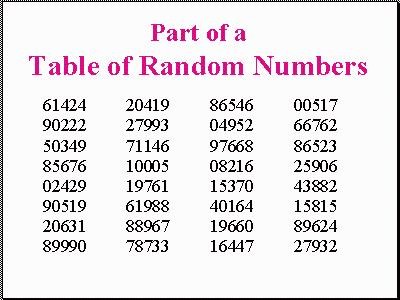
A partial table of random numbers used to generate chance-based outcomes, with each digit (0–9) equally likely and independent. Only a small portion of a larger table is shown, which is sufficient to demonstrate how simulations link random digits to modeled outcomes. The extra context on research design is present on the page but does not alter the image’s educational relevance. Source.
Designing a Simulation
Creating an effective simulation involves several structured steps. While the precise tools may vary, the underlying design principles remain consistent and rooted in the specification’s emphasis on modeling random events accurately.
Core Steps in Simulation Design
Clearly define the random process being modeled.
Identify all possible outcomes and ensure they reflect the real scenario.
Assign each outcome a chance-based representation, such as random digits.
Determine how many trials will be simulated.
Describe how simulated outcomes will be generated.
Establish a system for recording the count of each outcome and the total number of trials.
Trial: One complete run of a simulation that produces a single outcome.
Between these steps, clear documentation ensures the simulation can be repeated exactly the same way, preserving consistency across attempts.
Physical devices such as coins, dice, spinners, or shuffled cards can generate random outcomes, but technology is often more efficient for large simulations.

Two standard dice illustrate a simple physical chance mechanism used in statistical simulations. Each roll yields a random outcome, demonstrating how physical devices can replicate chance behavior. The image does not depict the mapping to simulation digits, but it directly supports the concept of random outcome generation. Source.
Recording Counts and Total Trials
The AP specification emphasizes tracking the counts of simulated outcomes along with the total number of simulated trials. These records are essential for analyzing the behavior of the random process.
A well-structured recording system includes:
A tally or running total for each outcome type.
A cumulative count of how many trials have been simulated.
A method for computing relative frequencies when needed.
Because simulations often involve large numbers of repetitions, accurate recordkeeping allows patterns to emerge that reflect the long-run behavior of the chance process.
Why Recording Matters
Recording outcomes is not merely clerical; it is fundamental to probability reasoning. Without counts, it is impossible to compare the frequency of outcomes, understand variability across simulations, or assess whether simulated behavior aligns with theoretical expectations. These records also set the foundation for later topics such as estimating probabilities or applying the law of large numbers.
Interpreting Simulated Outcomes
Once a simulation is complete, the student evaluates how the recorded outcomes reflect the underlying probability model. This step involves identifying patterns in the simulation data and considering whether these patterns approximate what the probability structure predicts. Interpretation is guided by the idea that simulations approximate real-world randomness only when each step has been properly designed, executed, and documented.
Through this process, students develop a deeper understanding of how randomness behaves and how probabilistic reasoning connects simulated models with genuine uncertainty in real contexts.
FAQ
Select the mechanism that most closely matches the probability structure and practical needs of your simulation.
If several tools match equally well, prioritise:
• The option that minimises bias (e.g., a computer generator over a worn die).
• The one that allows consistent repetition across trials.
• The method that best supports the number of trials you need to run.
In AP Statistics assessments, clarity of justification is often more important than the specific mechanism chosen.
Random digits are faster, more consistent, and less susceptible to physical imperfections than real objects.
They also allow:
• Large numbers of trials with minimal effort.
• More flexible modelling of probabilities that cannot be represented neatly with physical tools.
• Easy replication by other researchers or examiners following the same rules.
A realistic simulation mirrors both the structure and probabilities of the actual process.
This typically requires:
• All possible outcomes to be included without distortion.
• Assigned digits or values that represent probabilities accurately.
• Independence between trials when the real process is independent.
• A model that does not introduce patterns unrelated to chance.
There is no fixed rule, but the estimate improves as the number of trials increases.
Choose the number of trials based on:
• How variable the outcome is likely to be.
• The precision needed for your context.
• Practical constraints such as time or computational limits.
In AP Statistics, explaining why your chosen number is reasonable is often sufficient.
Minor deviations are normal, especially with small numbers of trials.
Consider:
• Whether the number of trials is too low to stabilise the relative frequencies.
• Whether the random mechanism or mapping of digits may have been biased or incorrectly applied.
• Checking for procedural errors, such as skipping digits or misreading intervals.
If the design is sound, increasing the trial count usually reduces inconsistency.
Practice Questions
Question 1 (1–3 marks)
A researcher wants to simulate the outcome of a random process in which an event has a 25% chance of occurring. They decide to use a table of random digits. Explain how they could assign digits to represent the event and describe how a single trial of the simulation would be carried out.
Question 1
• 1 mark: Correctly states that digits must be assigned so that 25% of them represent the event (e.g., 0–2 or 0–4 depending on chosen interval).
• 1 mark: Explains that a single random digit is selected from the table for each trial.
• 1 mark: States that the event is considered to have occurred if the digit falls within the assigned range; otherwise, it has not occurred.
Question 2 (4–6 marks)
A school is testing whether a new revision activity leads students to complete their homework more regularly. In reality, 60% of students complete their homework on any given day. The school designs a simulation to model three consecutive days, using random digits where 0–5 represent ‘homework completed’ and 6–9 represent ‘not completed’.
(a) Describe clearly how one trial of this simulation should be conducted.
(b) Explain how the school should keep track of the outcomes of many trials.
(c) Describe how the school could use the results of the simulation to estimate the probability that a student completes homework on at least two of the three days.
Question 2
(a) (2 marks)
• 1 mark: States that three random digits should be selected, one for each day.
• 1 mark: Explains that digits 0–5 represent completion and 6–9 represent non-completion for each selected digit.
(b) (1–2 marks)
• 1 mark: States that outcomes from each trial should be recorded, including the number of days with homework completed.
• 1 mark: Indicates that the total number of trials must also be recorded.
(c) (1–2 marks)
• 1 mark: Explains that the school counts how many trials resulted in at least two days of homework completion.
• 1 mark: States that the estimated probability is the relative frequency: number of successful trials divided by total number of trials.
