
AP Syllabus focus:
‘VAR-4.A.3: Explain that the probability of any event lies between 0 and 1, inclusive, where 0 indicates impossibility and 1 indicates certainty. This subsubtopic aims to solidify the learner's understanding of probabilities as measures of likelihood.’
Probability provides a structured way to describe how likely an event is, and the probability scale offers a universal framework for interpreting and comparing these likelihoods meaningfully.
The Probability Scale
The probability scale is a foundational concept in AP Statistics because it defines the range within which all probability values must fall. This range extends from 0 to 1, inclusive, and it applies to every possible event in a statistical context. Understanding this constraint is essential for interpreting probability statements, assessing the plausibility of claims, and evaluating whether computed probabilities are valid within the statistical framework.
The AP specification emphasizes that a probability of 0 represents an impossible event, while a probability of 1 represents a certain event.
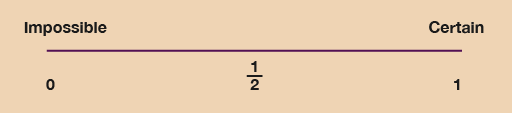
The probability scale is shown as a number line from 0 to 1, with 0 marking impossibility and 1 certainty. The midpoint ½ illustrates an even chance. The inclusion of ½ provides helpful context beyond the minimal syllabus requirement. Source.
All other events fall somewhere between these two extremes, indicating varying levels of likelihood. This perspective helps students conceptualize probability not as an abstract mathematical value but as a practical measure of how often an event can be expected to occur in the long run.
Interpreting the Endpoints of the Scale
The endpoints of the probability scale, 0 and 1, provide powerful interpretive anchors. When an event has probability 0, it cannot occur under the defined conditions of the random process. Conversely, a probability of 1 indicates that the event must occur whenever the process takes place. These endpoints create the boundaries for measurement and support consistent reasoning across different probability models.
Because these endpoints serve as absolutes, probabilities outside the interval from 0 to 1 are not valid.
This reinforces that probability is a constrained measure of likelihood rather than an unrestricted numerical value.
Understanding Intermediate Values
Most real-world events fall between these extremes, with probabilities strictly greater than 0 but less than 1. Intermediate values on the probability scale reflect varying degrees of likelihood. A value closer to 0 indicates that an event is unlikely, while a value closer to 1 indicates that it is likely.
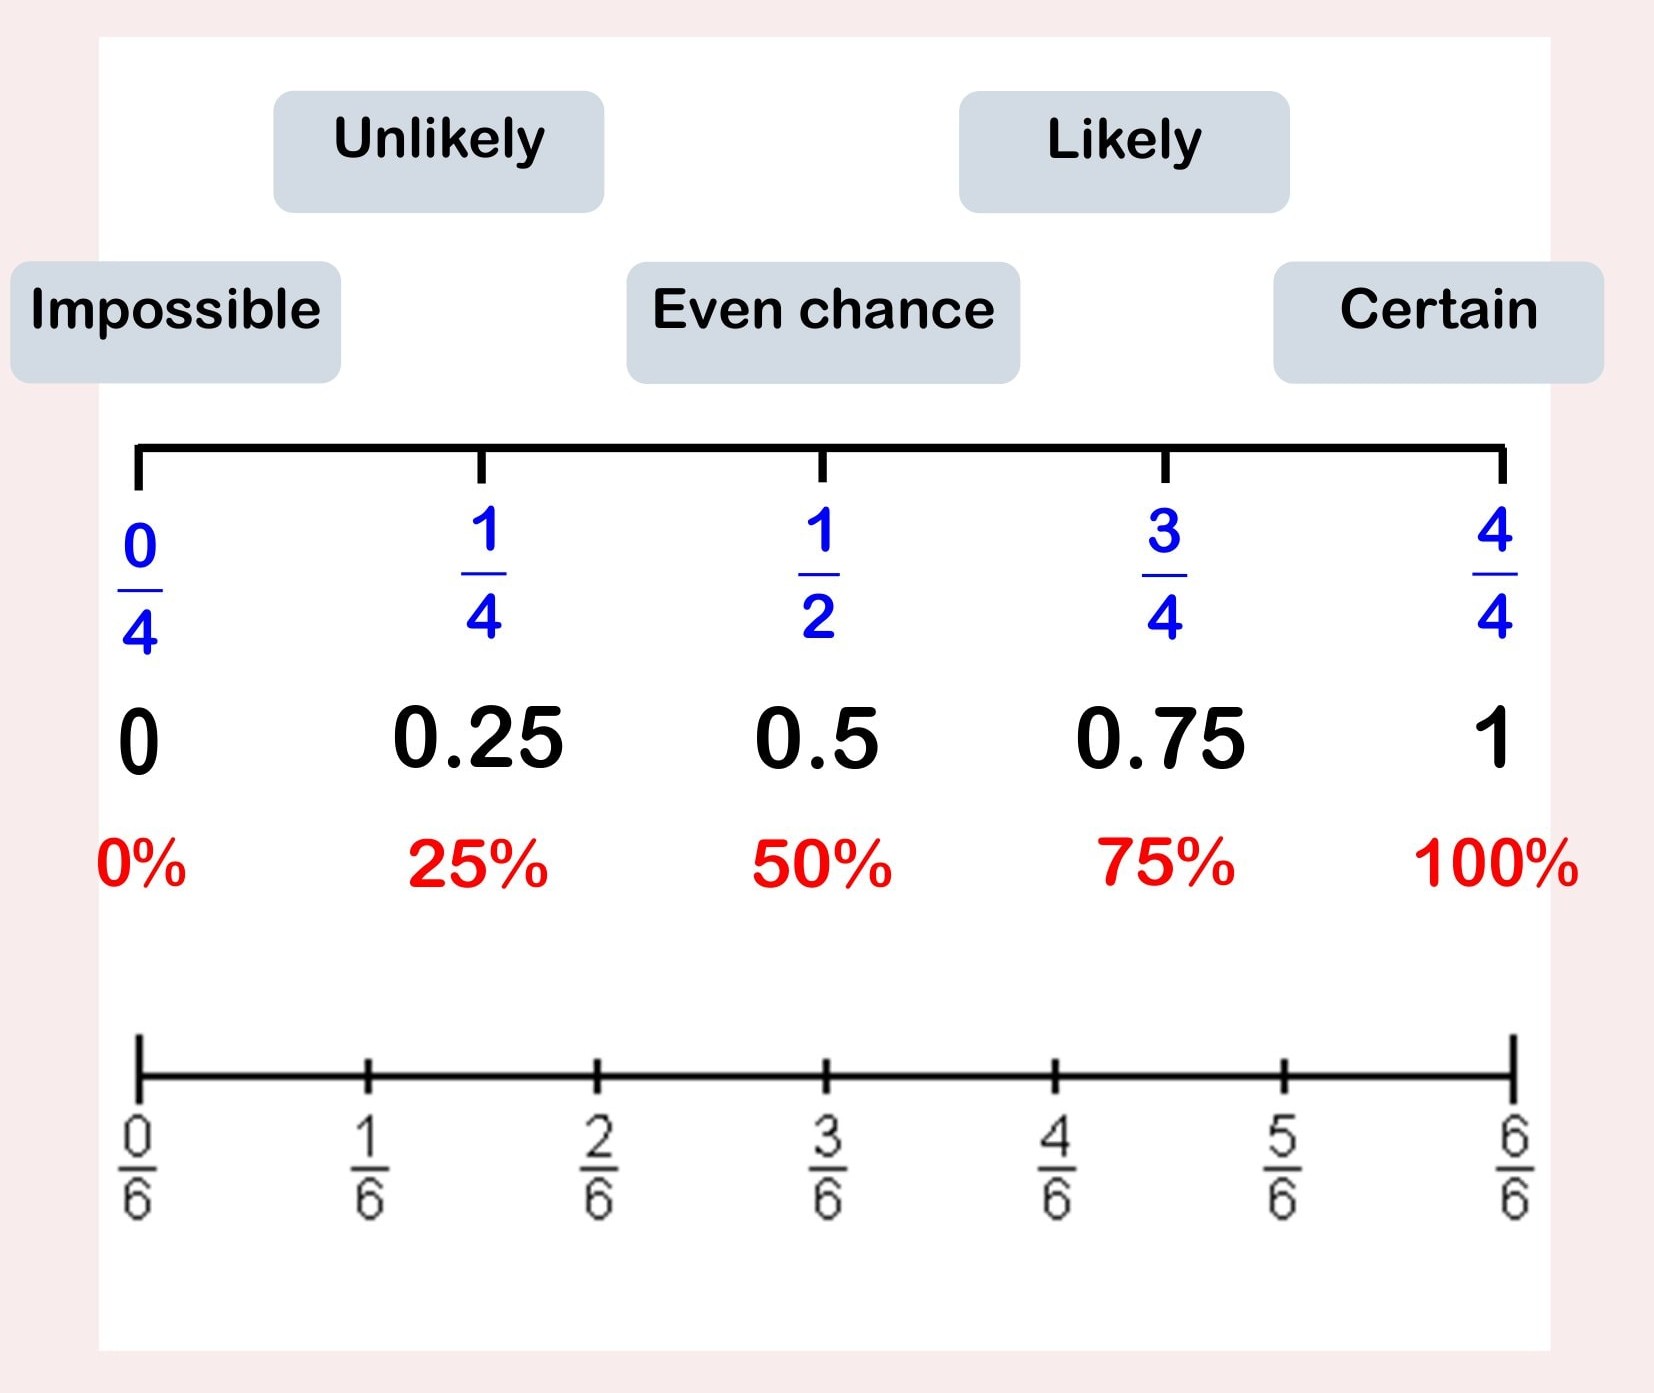
This extended probability scale shows benchmark values and their equivalent forms, helping students situate intermediate probabilities precisely. These additional markings enrich interpretation beyond the minimum syllabus requirements. The labeled ranges illustrate how likelihoods vary across the 0–1 interval. Source.
Each value can be interpreted as a measure of long-run relative frequency, framing probability as the expected proportion of times an event occurs across many repetitions of the random process.
Students benefit from recognizing that two events with different probabilities can be easily compared when they are placed along a standardized scale. This makes the probability scale instrumental for communication, decision-making, and evaluating claims based on data patterns.
Key Characteristics of the Probability Scale
The structure of the probability scale supports several important conceptual features:
Boundedness
Probabilities cannot exceed 1 or drop below 0.
Ensures interpretive consistency across all random processes.
Inclusiveness of Endpoints
Values exactly at 0 or 1 are permissible and meaningful.
Provides a complete scale that covers every possible likelihood.
Continuity
Probabilities can take any value within the interval from 0 to 1.
Allows precise expression of varying degrees of likelihood.
Comparability
Placing all event likelihoods on the same numerical interval makes it easy to judge which events are more or less likely.
These characteristics collectively support the statistical interpretation of probability as an objective measure tied to long-run behavior.
Probability as a Measure of Likelihood
The probability scale frames probability as a measure of likelihood, a key phrase emphasized in the syllabus. When students evaluate probability values, they are essentially assessing how frequently an event is expected to occur relative to all possible outcomes. This makes probability an indispensable tool for understanding uncertainty, modeling random behavior, and drawing data-driven conclusions.
Because probability quantifies uncertainty, it allows statisticians to articulate how confident they can be about different outcomes. Even though probability does not guarantee results in the short term, it provides a reliable structure for understanding long-term tendencies and for assessing observed patterns.
Representing Probabilities
Using the probability scale enables clear representation of probabilities in a variety of forms. Whether probabilities are expressed verbally, numerically, or through diagrams, the underlying scale ensures that all representations can be interpreted within the same conceptual framework. This consistency is especially important when comparing probability models or assessing probabilistic claims derived from different sources or contexts.
Applying the Probability Scale in Statistical Reasoning
Understanding the probability scale helps students evaluate whether statements or claims about likelihood make sense. Because probabilities are bounded, any value outside the interval from 0 to 1 signals an error in reasoning or computation. Additionally, recognizing that the probability scale is universal allows students to relate empirical results, theoretical models, and simulation-based estimates to the same interpretive structure.
The probability scale serves as a critical reference for distinguishing between reasonable and unreasonable probability claims. It also strengthens understanding of other probability rules encountered in AP Statistics, providing a foundation for interpreting complements, unions, intersections, and conditional probabilities.
By grounding probability in the 0-to-1 scale, students develop a clearer, more intuitive understanding of randomness, uncertainty, and the behavior of events in the long run.
FAQ
The probability scale offers a quick sense check: any claim implying a probability less than 0 or greater than 1 is automatically invalid.
When evaluating ordinary-language statements such as “almost certain” or “very unlikely,” the scale helps map these descriptions to approximate numerical ranges, enabling you to judge whether the claim seems plausible.
It also helps identify exaggeration or misunderstanding, especially when people describe rare events as either impossible or guaranteed.
A continuous scale allows probabilities to represent very fine differences in likelihood, which is essential in scientific contexts where small variations can matter.
For example, events with probabilities of 0.501 and 0.499 are nearly indistinguishable in everyday terms, but the continuous scale preserves this nuance for statistical modelling.
A restricted scale would oversimplify uncertainty and reduce the precision of predictions.
The scale provides a numerical anchor so you can compare gut feelings about likelihood with actual values.
For events that people frequently misjudge—such as rare but memorable accidents—the probability scale offers an objective reference that reveals when intuition is misleading.
This is particularly useful in risk communication, where emotional responses can distort perceived likelihoods.
The scale allows direct comparison even when the processes are completely unrelated.
If one process assigns a probability of 0.2 to an outcome and another assigns 0.6 to a different outcome, their relative likelihoods can be compared immediately because both are measured on the same bounded 0–1 scale.
This universal interpretive framework is essential for evaluating competing risks or outcomes across different fields.
The scale clarifies whether actions should be based on highly likely outcomes, moderately likely outcomes, or very unlikely ones.
It also helps identify when the chance of an unfavourable event is large enough to warrant precaution, even if the event is not highly probable.
Bullet points can guide decisions:
Near 0: risk usually negligible
Around 0.5: high uncertainty, decisions may require further information
Near 1: outcome very likely, action should reflect this
Practice Questions
Question 1 (1–3 marks)
A researcher states that the probability of a particular event occurring is 1.2.
(a) Explain why this value cannot be a valid probability.
(b) State the range of all possible probability values.
Question 1
(a) 1 mark: States that probabilities must lie between 0 and 1, inclusive, so 1.2 is outside the valid range.
(b) 1 mark: States the range as 0 to 1 inclusive or “between 0 and 1 inclusive.”
(Allow up to 1 additional mark for clear explanation or correct use of terms such as impossible/certain.)
Question 2 (4–6 marks)
A weather agency reports that the probability of heavy rainfall on a given day is 0.15, the probability of light rainfall is 0.30, and the probability of no rainfall is 0.55.
(a) Using the probability scale, describe what each of these three probabilities indicates about the likelihood of the corresponding event.
(b) Comment on whether these probabilities form a valid probability model. Justify your answer.
(c) A student claims that because the probability of heavy rainfall is 0.15, it is “almost impossible”. Evaluate this claim with reference to the probability scale.
Question 2
(a) Up to 2 marks:
1 mark for correctly identifying that 0.15 indicates an unlikely event.
1 mark for stating that 0.30 is more likely but still not highly likely, and 0.55 is the most likely of the three.
(b) Up to 2 marks:
1 mark for stating that the probabilities form a valid model because they sum to 1.
1 mark for noting that all values lie between 0 and 1 inclusive.
(c) Up to 2 marks:
1 mark for stating that 0.15 is low but not extremely close to 0.
1 mark for explaining that it is not “almost impossible” because an event with probability 0.15 can still occur reasonably often in repeated trials.
