
AP Syllabus focus:
‘Enduring Understanding VAR-5: Introduce parameters as numerical values that measure characteristics of populations or distributions of random variables. Emphasize that a parameter is a fixed value (Essential Knowledge VAR-5.C.1), laying the groundwork for more specific calculations.’
Understanding parameters of random variables is essential because these fixed numerical values describe fundamental characteristics of a population or distribution, supporting deeper analysis and meaningful statistical interpretation.
Parameters and Their Role in Random Variables
Parameters play a central role in probability and statistics because they describe aspects of an entire population or the full probability distribution of a random variable. When working with random variables, parameters allow statisticians to quantify features such as typical outcomes and variability across repeated random processes. These values remain constant for a given distribution, even though observed sample data may fluctuate.
Parameter: A fixed numerical value that describes a characteristic of a population or probability distribution, such as its center or spread.
A parameter differs from a sample statistic, which is derived from observed data. While statistics vary from sample to sample, parameters do not change unless the underlying distribution changes. Understanding this distinction helps students interpret probability models effectively and prepares them to work with more complex random variable structures.
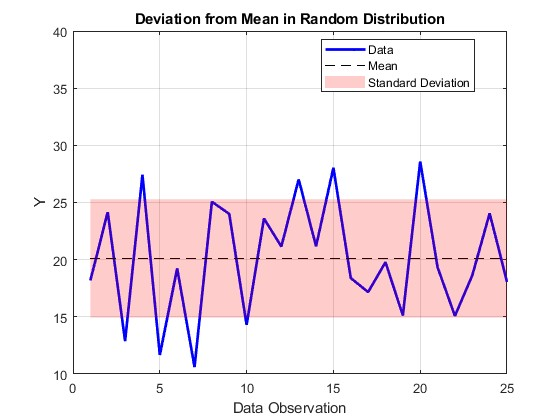
This plot displays fluctuating observations around a fixed mean, with a shaded band indicating one standard deviation. It visually shows how data vary while parameters remain constant for the underlying distribution, illustrating the distinction between sample statistics and population parameters. Source.
The Importance of Fixed Values in Distribution Descriptions
In probability distributions, describing characteristics consistently is essential for comparing, modeling, and predicting random behavior. Because parameters do not vary, they anchor the distribution and define expected patterns. They also allow researchers to use theoretical probability models to anticipate long-run behavior, supporting the foundational principle that random variables represent the numerical outcomes of chance processes.
A key feature of parameters is that they apply regardless of whether the random variable is discrete or continuous, though later AP Statistics topics primarily explore discrete cases first. Their fixed nature ensures that the distribution has a stable identity, enabling students to apply formulas, interpret results, and communicate findings clearly.
Types of Parameters in Random Variable Distributions
Different parameters measure different features of a distribution. The two most commonly studied parameters in AP Statistics describe the center and spread of a random variable’s distribution. These parameters provide complementary information that supports thorough interpretation of the random process.
Measures of Center
The primary parameter measuring the center of a random variable is its mean, often called the expected value. The mean expresses what outcome would occur “on average” across an extremely large number of independent repetitions of the random process. Although individual observations may vary widely, the mean remains fixed for the distribution itself.
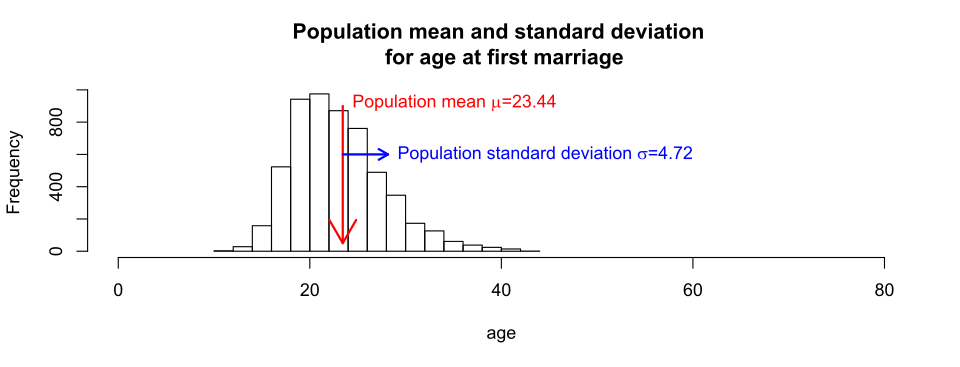
This figure illustrates a distribution with its mean and standard deviation clearly marked. It demonstrates how the mean identifies the center of the distribution while the standard deviation reflects expected long-run variability. The real-world context shown here exceeds syllabus requirements but enhances conceptual understanding. Source.
EQUATION
= Parameter describing the long-run average of the random variable X
Between two parameters, the mean provides directional insight into the behavior of a variable by identifying its central tendency. This orientation helps students understand where the distribution is centered and what values are most characteristic of the underlying process.
Measures of Spread
Another central parameter describes how much the values of a random variable tend to vary around the mean. This measurement of spread reflects the variability built into the random process and shows how concentrated or dispersed outcomes are.
Standard Deviation: A parameter that measures how much the values of a random variable typically differ from the mean of its distribution.
A distribution with low spread produces outcomes clustered closely around the mean, while a high spread indicates considerable variation.
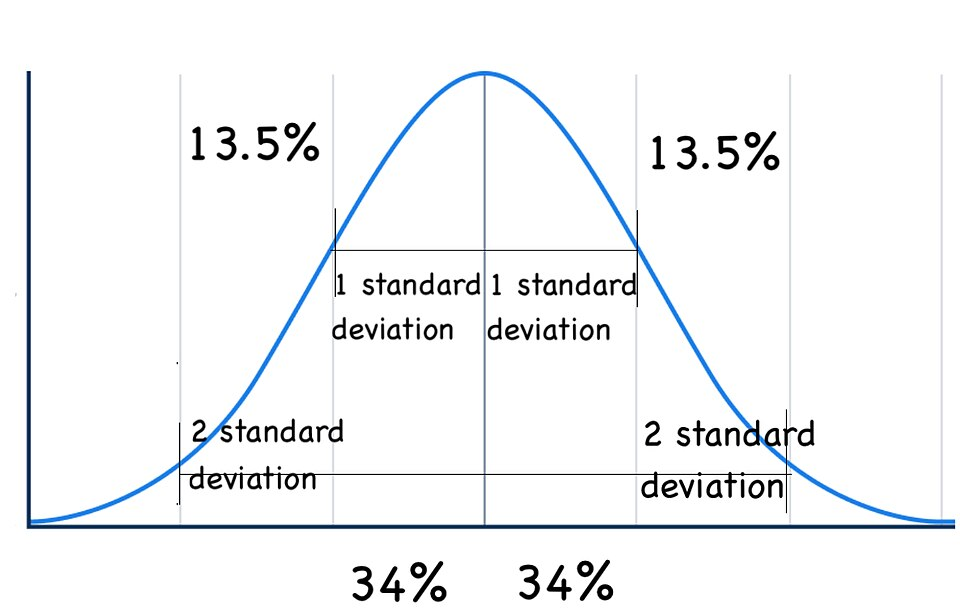
This diagram displays a normal distribution with labeled standard deviation intervals, illustrating how spread determines the distribution of values around the mean. The added percentages extend beyond this subsubtopic’s requirements but provide helpful intuition about the role of standard deviation in long-run frequencies. Source.
Why Parameters Matter in Statistical Interpretation
Students must understand parameters because they define the true underlying distribution, enabling probability calculations and informed interpretation. Even when data vary unpredictably, parameters provide the stable reference points needed to explain and anticipate long-run patterns.
Key reasons parameters matter include:
They describe population-level characteristics, not sample-level fluctuation.
They enable probability predictions that rely on stable distributional features.
They support rigorous comparison across different random variables or populations.
They form the foundation for later calculations of means and standard deviations for discrete random variables.
They guide interpretation by distinguishing inherent variability from sampling variability.
Parameters in Context of Random Variables
In AP Statistics, parameters serve as the anchor when connecting theoretical models to real-world situations. When students interpret a random variable, they rely on parameters to articulate claims about typical outcomes, expected long-run behavior, and the consistency or variability of results. Understanding parameters at this conceptual level ensures a strong foundation for all subsequent work involving probability distributions, including calculating expected values, computing standard deviations, combining random variables, and interpreting distributional results in applied contexts.
Since parameters remain fixed, they provide clarity amid randomness, allowing statisticians to make meaningful, consistent statements about populations and random processes even when individual outcomes vary widely.
FAQ
Parameters act as fixed inputs that define how a probability model behaves. Once established, they allow the model to generate predictions about long-run outcomes.
In practice, parameters guide decisions such as setting quality control thresholds or estimating expected performance. They remain constant unless the underlying process truly changes, ensuring consistent interpretation.
A population refers to the entire distribution of possible outcomes, not just observed data. Parameters describe this full distribution, even if it cannot be observed directly.
A sample only provides partial information. Its statistics may vary from sample to sample, but parameters remain tied to the complete underlying process.
Usually, parameters are not known with certainty because full populations are rarely observable.
However, they may be known exactly when:
• The process is defined mathematically, such as a theoretical probability distribution.
• A system’s mechanism is fully controlled and constant, producing fixed long-run behaviour.
A parameter is meaningful when it captures a stable, interpretable aspect of the distribution, such as its centre or degree of spread.
Meaningfulness also depends on:
• Whether the parameter aligns with the context (for example, mean is not useful for highly skewed processes).
• Whether it supports comparison across time, groups, or processes.
Although parameters themselves do not change within a stable process, monitoring sample statistics can reveal shifts that suggest changes in the underlying parameters.
Signs include:
• Persistent movement of sample means away from the expected value.
• Increased or decreased sample variability relative to the parameter’s standard deviation.
Such patterns may indicate that the population distribution has altered.
Practice Questions
Question 1 (1–3 marks)
A random variable X represents the number of defects found in identical manufactured items produced under the same conditions. Explain what is meant by a parameter of the random variable X and identify one parameter that could describe this distribution.
Question 1 (1–3 marks)
• 1 mark for stating that a parameter is a fixed numerical value describing a characteristic of a population or distribution.
• 1 mark for indicating that it does not change from sample to sample.
• 1 mark for correctly identifying a parameter such as the population mean or population standard deviation.
Question 2 (4–6 marks)
A factory monitors the weight of cereal filled into boxes each day. The weights can be modelled as a random variable Y with a fixed population mean and a fixed population standard deviation.
a) Explain why the mean of Y is considered a parameter.
b) Discuss how the standard deviation of Y helps describe the long-term behaviour of the filling process.
c) A manager claims that because the observed daily weights vary, the parameters of the distribution must also be changing. Evaluate this claim using the concept of parameters.
Question 2 (4–6 marks)
a) (1–2 marks)
• 1 mark for stating that the mean is a fixed numerical value describing the centre of the population distribution of Y.
• 1 mark for explaining that it does not depend on individual daily samples.
b) (1–2 marks)
• 1 mark for recognising that the standard deviation measures the spread or variability of Y around the mean.
• 1 mark for explaining that it describes how much the weights typically deviate in the long run.
c) (2 marks)
• 1 mark for stating that variability in observed data does not imply a change in parameters.
• 1 mark for explaining that parameters remain constant unless the underlying distribution changes, so the manager's claim is not justified based solely on sample fluctuations.
