
AP Syllabus focus:
'Detail the formula and method for calculating the standard deviation of a discrete random variable X, emphasizing the formula's components and the interpretation of standard deviation in terms of the variability or dispersion of the random variable's values (VAR-5.C.3).'
Understanding how to calculate the standard deviation of a discrete random variable is essential because it shows how much the values of the variable typically differ from its mean. This measure helps quantify variability.
Calculating the Standard Deviation of a Discrete Random Variable
The standard deviation of a discrete random variable is a core concept in AP Statistics because it expresses how spread out the values of the variable are around the mean. According to the specification, students must know the formula used to compute this parameter, how each component contributes to the calculation, and how to interpret the measure in the context of variability.
The Role of Variability in Discrete Random Variables
Variability describes how much the outcomes of a random variable differ from one another. For a discrete random variable, each possible value has an associated probability, and these probabilities determine how the distribution behaves. The standard deviation serves as a numerical description of this variability, offering a single value that summarizes how far typical observations fall from the mean.
Understanding the Components of Standard Deviation
The process of calculating the standard deviation begins with recognizing that it stems from variance, which reflects the average squared distance from the mean.
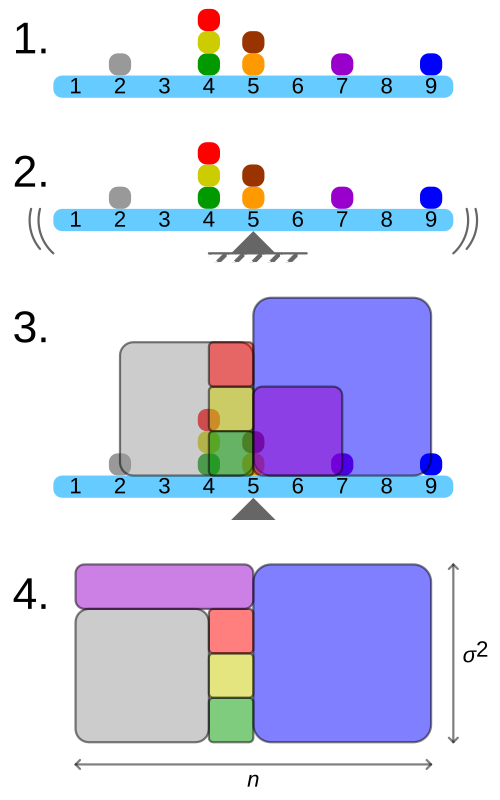
This figure illustrates a discrete distribution, its mean, and how each value’s distance from the mean is turned into a square whose area represents a squared deviation. Rearranging these squares into a single rectangle corresponds to the variance, highlighting that variance is built from all squared deviations. The image uses one specific example dataset, but the construction applies to any discrete random variable. Source.
Standard deviation is, in turn, the square root of this value. Because the units of variance are squared, taking the square root allows the measure to be expressed in the same units as the original random variable.
Standard Deviation: A numerical measure that describes the typical distance between the values of a random variable and its mean.
The calculation incorporates each possible value of the random variable, the deviation of that value from the mean, and the probability associated with the value. This combination ensures that the variability reflects not only the distances from the mean but also the likelihood of observing those distances.
Formula for the Standard Deviation of a Discrete Random Variable
Students should understand every component of the formula to apply it meaningfully. The standard deviation is always non-negative, and larger values indicate greater spread in the distribution.
EQUATION
= Each possible value of the discrete random variable X
= Mean (expected value) of X
= Probability of observing value
= Standard deviation of X, in the same units as X
This formula weights each squared deviation by its probability, creating an accurate representation of variability across all possible outcomes. Because each squared deviation is multiplied by its probability, outcomes that are more likely have a stronger influence on the final measure of spread.
A key characteristic of this formula is that it accounts for the full distribution of the random variable. No value is ignored, and all probabilities must sum to 1. This makes the standard deviation a comprehensive measure that reflects both the shape of the distribution and the likelihood of various outcomes.
Interpreting the Standard Deviation
Interpreting the standard deviation is just as important as computing it. A small standard deviation indicates that values typically cluster close to the mean, suggesting low variability. Conversely, a large standard deviation signifies that values tend to be more spread out, meaning greater variability.
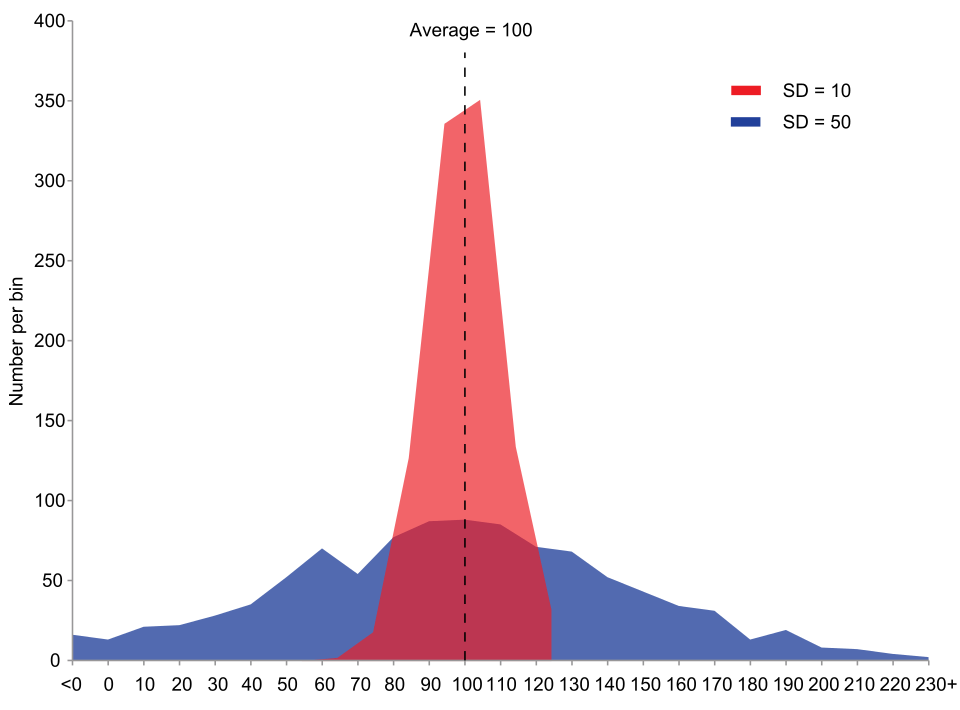
This graph compares two distributions with the same mean but very different standard deviations: the red distribution is tightly concentrated around the mean, while the blue distribution is much more spread out. It illustrates how increasing standard deviation stretches the distribution horizontally, even when the center remains fixed. The image is based on continuous normal distributions rather than discrete random variables, but it conveys the same idea of greater spread corresponding to a larger standard deviation. Source.
When applying this measure, it is crucial to interpret the standard deviation within the context of the original variable. Because standard deviation is expressed in the same units as the random variable, it allows meaningful comparisons and interpretations within real-world contexts.
Key Points for AP Students
To master this subsubtopic, students should focus on the following essential ideas:
Standard deviation quantifies variability in the distribution of a discrete random variable.
Calculating the standard deviation relies on variance, which involves squared deviations from the mean.
Probabilities weight each squared deviation, ensuring the measure reflects the full distribution.
Units matter: the standard deviation uses the same units as the random variable, making interpretation intuitive.
The formula must be applied exactly as defined in the AP syllabus, and each variable within the formula plays a critical role in describing the distribution's spread.
Understanding the method and meaning of standard deviation prepares students to analyze distributions effectively, supporting deeper insight into how random variables behave in statistical contexts.
FAQ
Variance provides a mathematically convenient way to measure average deviation because squaring deviations removes negative signs and emphasises larger differences from the mean.
Standard deviation is then taken as the square root so that the final measure returns to the original units, making interpretation practical.
This two-step process ensures both mathematical stability and meaningful real-world interpretation.
Distributions with heavier tails or more extreme values tend to produce larger standard deviations because extreme deviations from the mean increase variance.
Symmetric but wide distributions also yield larger standard deviations, while tightly concentrated or peaked distributions tend to have smaller ones.
Clusters of probability far from the mean exert especially strong influence because squared deviations magnify their impact.
Yes. Standard deviation reflects only overall spread, not the specific pattern of probability across values.
Two variables may have completely different shapes, symmetry, or clustering patterns but still share the same degree of overall variability.
This occurs because standard deviation summarises dispersion into a single number, ignoring structural differences in how probability is arranged.
Each value contributes to total variability in proportion to how likely it is to occur.
Values with high probability influence the standard deviation more strongly, because they represent more of the distribution’s long-run behaviour.
Less probable extreme values still affect the standard deviation, but their effect is moderated by their small probability.
Shifting all values by the same constant changes the mean but does not affect the spread.
The distances between values remain identical, so the deviations from the mean stay the same, and therefore both variance and standard deviation remain unchanged.
This property is essential for interpreting transformed variables and understanding which aspects of a distribution affect variability.
Practice Questions
Question 1 (1–3 marks)
A discrete random variable X has the following probability distribution:
Value: 2, 5, 8
Probability: 0.4, 0.4, 0.2
Calculate the standard deviation of X. Show all working clearly.
Question 1 (1–3 marks)
• 1 mark: Correct calculation of the mean of X using values multiplied by their probabilities.
• 1 mark: Correct calculation of the variance using squared deviations multiplied by probabilities.
• 1 mark: Correct calculation of the standard deviation as the square root of the variance.
Question 2 (4–6 marks)
A discrete random variable R represents the number of defective items found in a small sample taken from a production line. The distribution of R is shown below:
Value: 0, 1, 2, 3
Probability: 0.5, 0.3, 0.15, 0.05
(a) Calculate the mean of R.
(b) Using your result from part (a), calculate the standard deviation of R.
(c) Comment on what the standard deviation suggests about the variability in the number of defective items.
Question 2 (4–6 marks)
(a)
• 1 mark: Correct set–up of the expression for the mean.
• 1 mark: Correct numerical value for the mean.
(b)
• 1 mark: Correct squared deviations from the mean multiplied by probabilities.
• 1 mark: Correct calculation of the variance.
• 1 mark: Correct standard deviation value.
(c)
• 1 mark: Clear contextual interpretation relating the standard deviation to the typical deviation from the mean number of defective items.
