
AP Syllabus focus:
‘Learning Objective VAR-5.D: Discuss how to interpret parameters such as mean and standard deviation for a discrete random variable within the context of specific populations, including using appropriate units (VAR-5.D.1), to derive meaningful insights from statistical analyses.’
Understanding how to interpret parameters of random variables is essential for drawing meaningful conclusions from statistical information. These parameters help describe the behavior of a population and support evidence-based reasoning.
Interpreting Parameters of Random Variables
Interpreting the parameters of a discrete random variable involves understanding what the mean and standard deviation reveal about the population or process represented by the variable.

A bar graph of a discrete probability distribution that highlights three possible values and their associated probabilities, illustrating how a probability mass function organizes the values of a discrete random variable. Source.
These interpretations provide essential insight into long-run tendencies and the variability of outcomes.
The Role of Parameters in Statistical Interpretation
Parameters are key descriptors that summarize the long-run characteristics of a random variable’s distribution. Because they describe the entire population or process rather than a single sample, parameters provide clarity about expected behavior and variability across many repetitions of the underlying random process.
Parameter: A fixed numerical value that describes a characteristic of a population or the probability distribution of a random variable.
When interpreting parameters, it is important to focus on what they imply in the context of actual units, processes, or decisions. These interpretations connect abstract numerical values to meaningful real-world expectations.
Interpreting the Mean of a Random Variable
The mean of a discrete random variable represents the long-run average outcome if the random process were repeated indefinitely. Rather than describing a single outcome, the mean reflects the balancing point of the distribution, indicating where values tend to cluster over many repetitions of the random event.
EQUATION
= Possible value of the random variable (in context)
= Probability of observing
Because the mean incorporates every possible value and its probability, it reflects both the structure and the probability distribution of the variable.

A probability mass function for the sum of two fair dice, showing a clear center at 7 and decreasing probabilities outward, illustrating how the mean represents a long-run average and how the distribution’s shape relates to the interpretation of parameters. Source.
This gives students a tool for predicting long-run performance or typical behavior in real-world settings.
To interpret a mean correctly, the numerical result must be stated in proper context and appropriate units. The AP Statistics specification emphasizes that parameters must be tied to the relevant population or scenario, making the interpretation meaningful and accurate.
Interpreting the Standard Deviation of a Random Variable
The standard deviation of a random variable measures how much the values typically vary from the mean in the long run. A larger standard deviation indicates greater spread or uncertainty, while a smaller standard deviation suggests outcomes that cluster closely around the mean.
EQUATION
= Long-run typical distance of outcomes from the mean
Interpreting the standard deviation requires connecting the magnitude of the variation to the units and context of the random process.
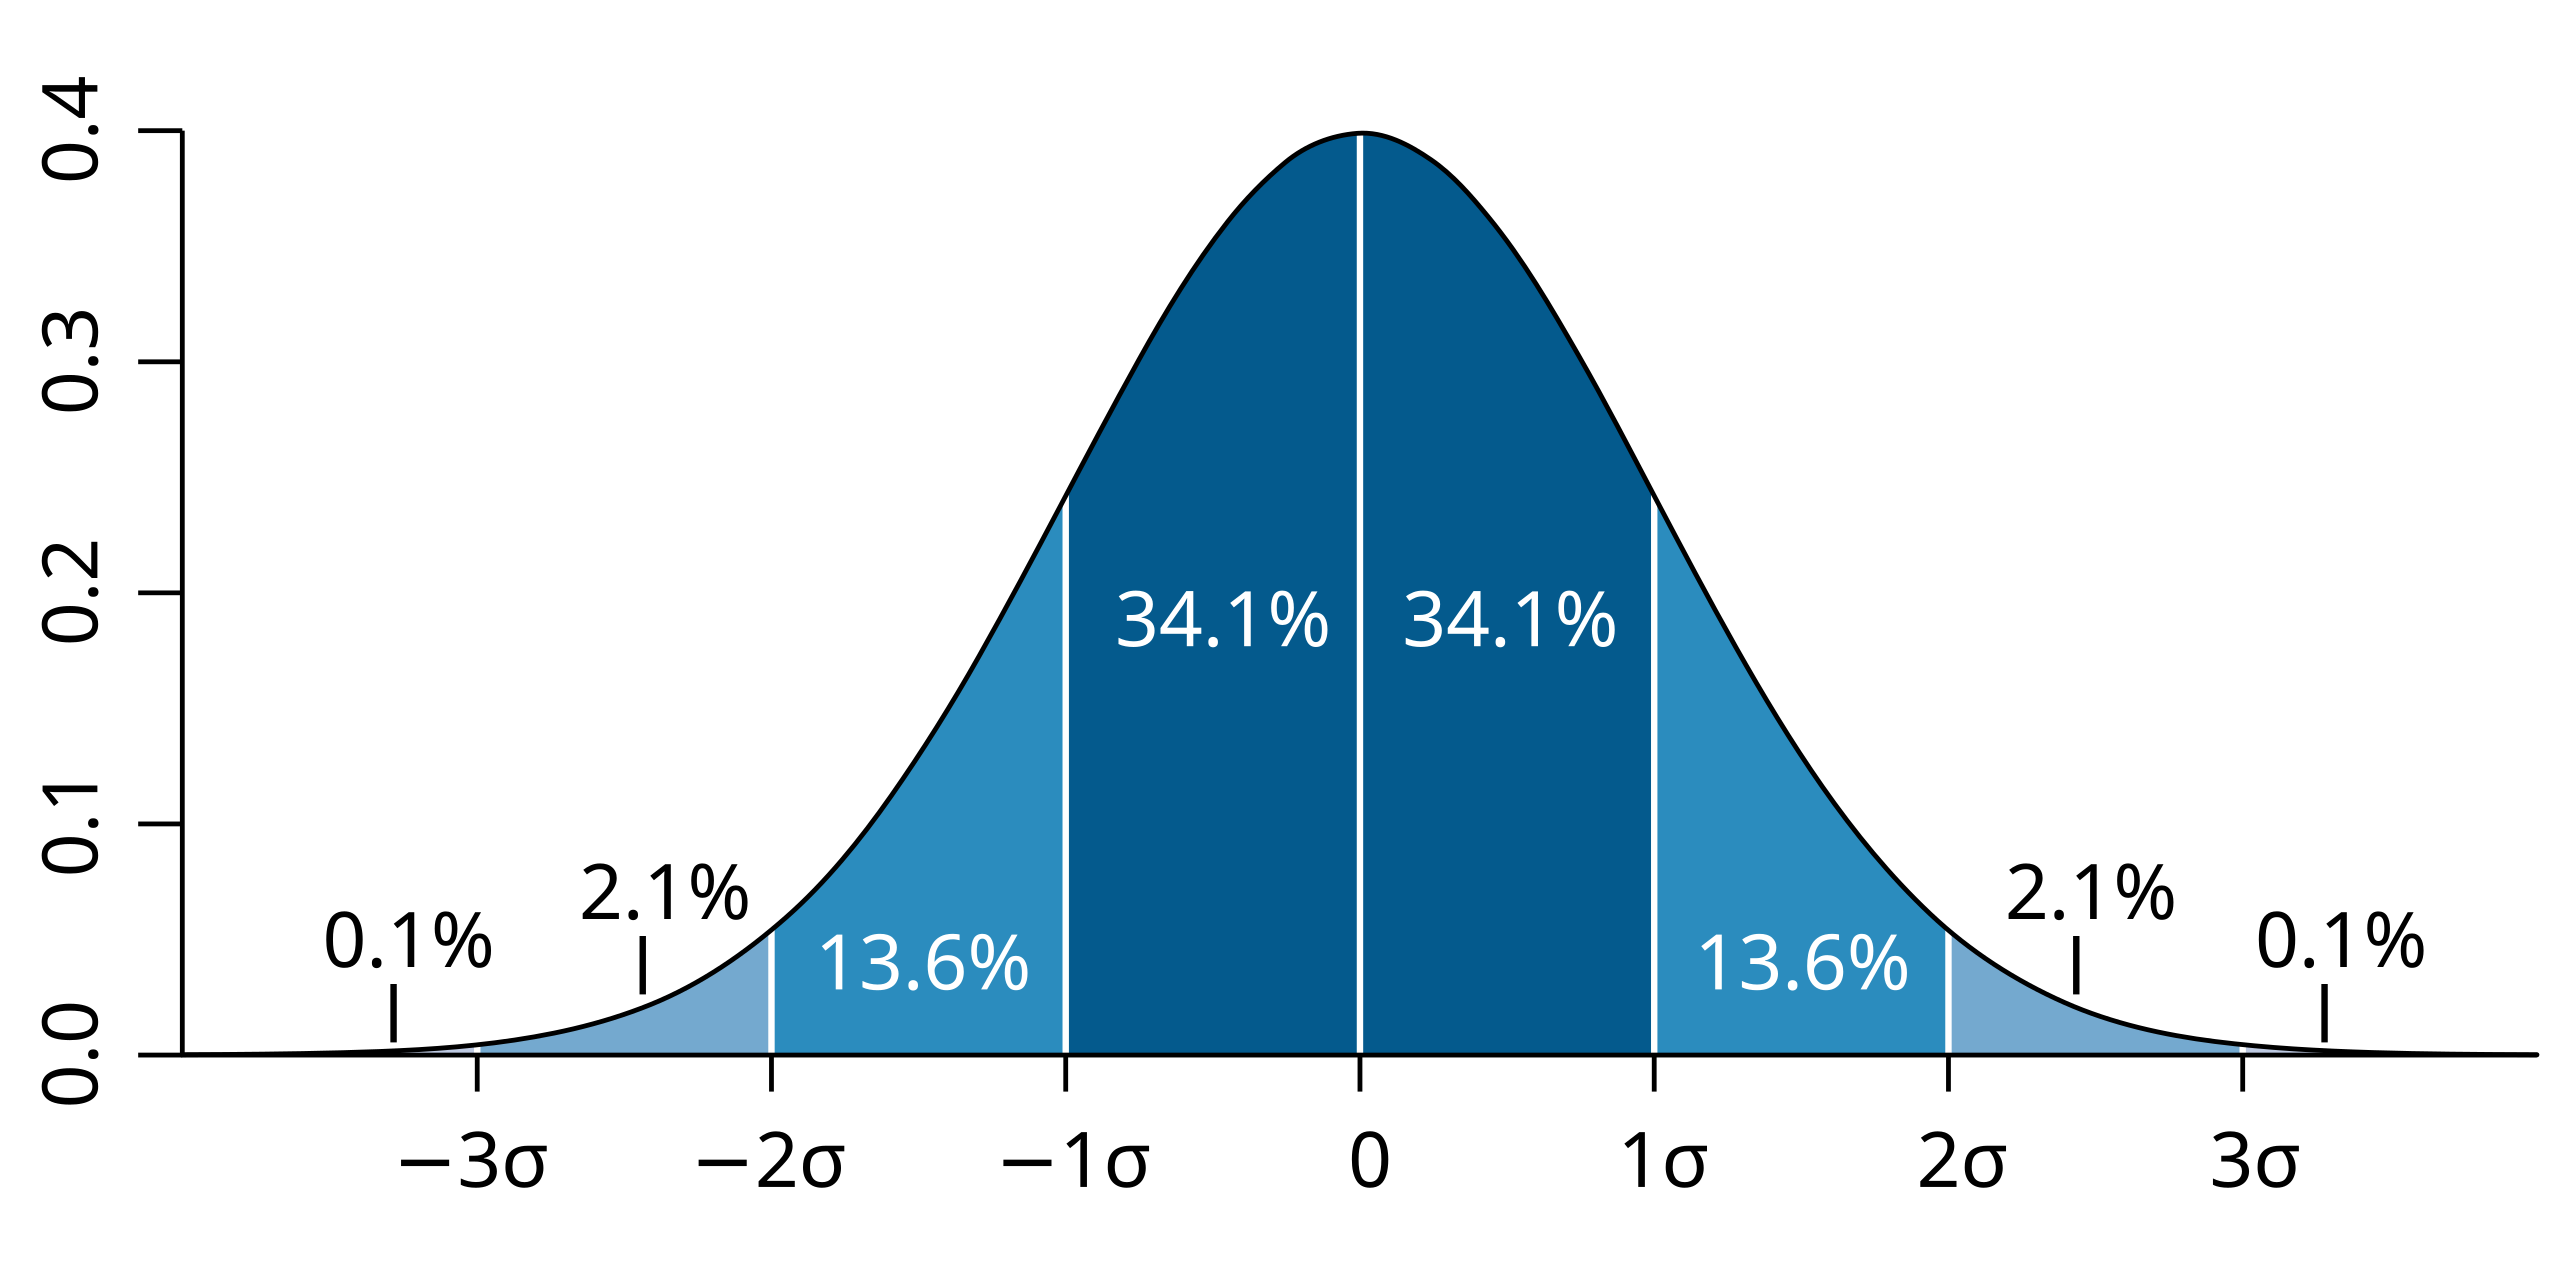
A normal curve marked with one, two, and three standard deviations from the mean, visually emphasizing the idea of standard deviation as a typical distance from the center. Although shown for a continuous distribution, it provides intuitive insight into the concept of spread. Source.
This ensures that the interpretation communicates not only how much variation exists but what that variability means for the scenario being analyzed.
Connecting Parameters to Populations and Contexts
Interpreting parameters depends heavily on the population of interest. Context is essential because the same numerical values can carry different implications depending on what the random variable represents. Students must be able to clearly state what the mean and standard deviation describe about the broader process or population.
Some key considerations when interpreting parameters include:
Units must always appear in the interpretation, matching the units of the random variable.
The mean describes a long-run average, not a single expected outcome.
The standard deviation communicates typical variability, summarizing how spread out the outcomes are.
The interpretation must relate back to the underlying population, not just the mathematical value.
These principles ensure that statistical interpretations reflect the behavior of the random process rather than the mechanics of calculation.
Using Parameters to Derive Insights
Interpreting parameters allows students to make informed statements about the distribution of a random variable and the population it represents. By focusing on long-run expectations and variability, parameters support thoughtful reasoning about uncertainty and patterns in random processes.
When students articulate interpretations that include units, context, and clear descriptions of what the mean and standard deviation reveal, they demonstrate mastery of how parameters provide insight into population behavior. This aligns directly with Learning Objective VAR-5.D, which emphasizes using these interpretations to generate meaningful statistical understanding grounded in contextually relevant information.
FAQ
Calculating a parameter gives a numerical summary of a distribution, whereas interpreting it involves explaining what that value means for the real-world process being modelled.
Interpretation places the parameter in context by addressing its units, what population it describes, and how it reflects long-run behaviour rather than a single isolated outcome.
Units clarify what the parameter is describing and prevent ambiguity, especially when different variables use different measurement scales.
Including units helps distinguish whether a value represents, for example, customers, minutes, deliveries, or complaints—ensuring the interpretation remains tied to the specific context of the random variable.
Yes. Even when means match numerically, they may describe entirely different processes with distinct real-world implications.
Interpretation depends on:
• What the random variable represents
• The population or scenario being modelled
• How outcomes behave in the long run
Thus, identical means do not imply identical behaviour across contexts.
Standard deviation reflects typical variability, and the meaning of that variability depends strongly on the situation.
A standard deviation that is large in one context may be negligible in another. For example, a spread of two units may be trivial for daily sales but substantial for machine error counts.
Context determines what level of variability is meaningful or concerning.
Misinterpretation may cause overconfidence in single outcomes or incorrect assumptions about expected behaviour.
Common pitfalls include:
• Treating the mean as a prediction for one trial
• Ignoring the magnitude of variation implied by the standard deviation
• Forgetting that parameters describe long-run tendencies, not guarantees
These errors can distort decision-making in real-world applications.
Practice Questions
Question 1 (1–3 marks)
A discrete random variable X represents the number of defective items found in a quality check each hour. The mean of X is 1.3 defects, and the standard deviation is 0.6 defects.
Explain, in context, what the mean and standard deviation indicate about the defects found during quality checks.
Question 1
• 1 mark for stating that the mean of 1.3 defects means that, in the long run, the average number of defects per hour is about 1 to 2.
• 1 mark for correctly using context and units (defects per hour).
• 1 mark for interpreting the standard deviation as the typical amount by which the number of hourly defects varies from the mean.
Total: 3 marks
Question 2 (4–6 marks)
A discrete random variable Y represents the number of emails a helpdesk resolves per 15-minute interval. The mean is 4.7 emails, and the standard deviation is 1.4 emails.
A manager claims that "the helpdesk typically resolves between 3 and 7 emails every 15 minutes."
(a) Using the mean and standard deviation, comment on whether this claim is reasonable.
(b) Explain why interpreting the mean and standard deviation in context is necessary when evaluating helpdesk performance.
Question 2
(a)
• 1 mark for identifying that most outcomes lie within roughly one standard deviation of the mean (about 3.3 to 6.1 emails).
• 1 mark for comparing this interval with the manager’s stated range of 3 to 7 emails.
• 1 mark for concluding whether the claim is reasonable, noting that the stated range is slightly wider than typical but still plausible.
(b)
• 1 mark for explaining that interpreting parameters in context clarifies what the mean and standard deviation represent in real operational terms.
• 1 mark for noting that understanding long-run averages and typical variation helps evaluate performance expectations accurately.
Total: 6 marks
