
AP Syllabus focus:
‘Interpreting probabilities and parameters in the context of a sampling distribution for sample means involves:
- Using appropriate units of measure.
- Considering the specific context of the population and sample under study.
- Understanding the implications of the sampling distribution's parameters (mean and standard deviation) for making inferences about the population mean.’
Understanding how to interpret a sampling distribution for sample means is essential for linking statistical theory to real-world reasoning, allowing students to make justified claims about population characteristics.
Interpreting Sampling Distributions for Sample Means
A sampling distribution for a sample mean describes the behavior of the sample mean across all possible random samples of the same size from a population. Interpreting this distribution correctly allows us to connect sample-level information to population-level conclusions, which is a central goal of statistical inference. The AP specification emphasizes interpretation using correct units, appropriate context, and understanding the implications of the distribution’s mean and standard deviation.
Understanding Parameters in Context
When working with sampling distributions, the two parameters that guide interpretation are the mean of the sampling distribution and the standard deviation of the sampling distribution. These parameters describe how sample means behave, not how individual data values behave, which is a distinction students must consistently maintain.
Sampling Distribution Mean (): The long-run average of all possible sample means, equal to the population mean .
Because the sampling distribution mean equals the population mean, interpreting it requires stating the connection explicitly in context. For example, if a population mean represents a typical measurement, then the sampling distribution mean represents the long-run average of sample means for that same measurement. The unit of measurement always matches the population variable.
Standard Deviation and Variability of Sample Means
The standard deviation of the sampling distribution communicates how much the sample means vary from sample to sample. Its role is to describe the expected spread of sample means rather than the spread of individual observations.
EQUATION
= Standard deviation of the sampling distribution (same unit as the variable)
= Population standard deviation (same unit as the variable)
= Sample size (number of observations in each sample)
This equation highlights that increasing the sample size reduces the variability of the sample mean, which strengthens the precision of inferences. When interpreting this parameter, students should focus on what it tells them about the expected closeness of sample means to the population mean.
The sampling distribution of x̄ has mean equal to the population mean and standard deviation equal to the standard error, so larger samples produce less variable sample means.
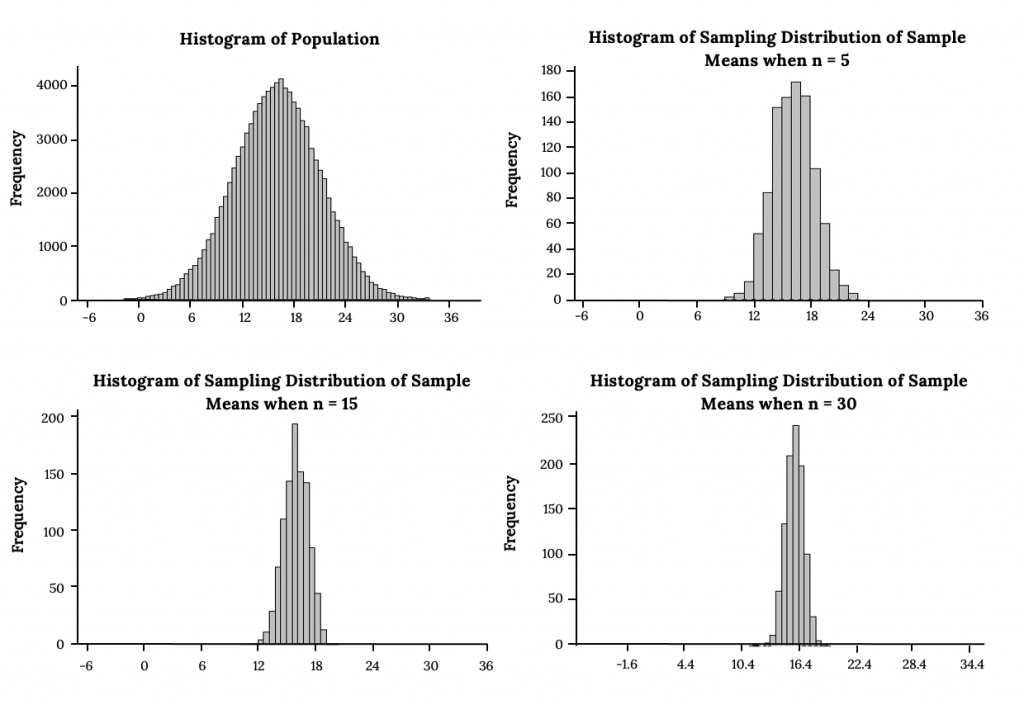
This figure compares the population distribution with sampling distributions of the sample mean for different sample sizes. Each distribution of x̄ remains centered at the population mean but narrows as n increases, illustrating how the standard error decreases. It visually reinforces how sample means become more consistent as sample size grows. Source.
Using Appropriate Units in Interpretation
Units play a vital role in interpretation. Each statistic, parameter, or distributional value must be expressed in the same units as the underlying numerical variable. Without proper units, statements lose meaning, especially when comparing statistics or making probability claims. Units should always match the context of the study, such as grams, hours, dollars, or centimeters.
Interpreting Probabilities from a Sampling Distribution
Probabilities in a sampling distribution describe the likelihood of obtaining a sample mean in a particular range when repeatedly sampling from the population. These probabilities do not refer to individual data points; instead, they express the behavior of the sample mean across samples.
When interpreting probabilities, students should:
Identify clearly that the probability relates to the sample mean , not individual observations.
Connect probability statements to the defined context of the population and sampling process.
Use correct units for any bounds or values referenced in the probability statement.
Phrase interpretations in terms of long-run relative frequency of sample means.
When the sampling distribution of x̄ is approximately normal, probabilities about the sample mean are interpreted as areas under the normal curve, measured in standard-error units.
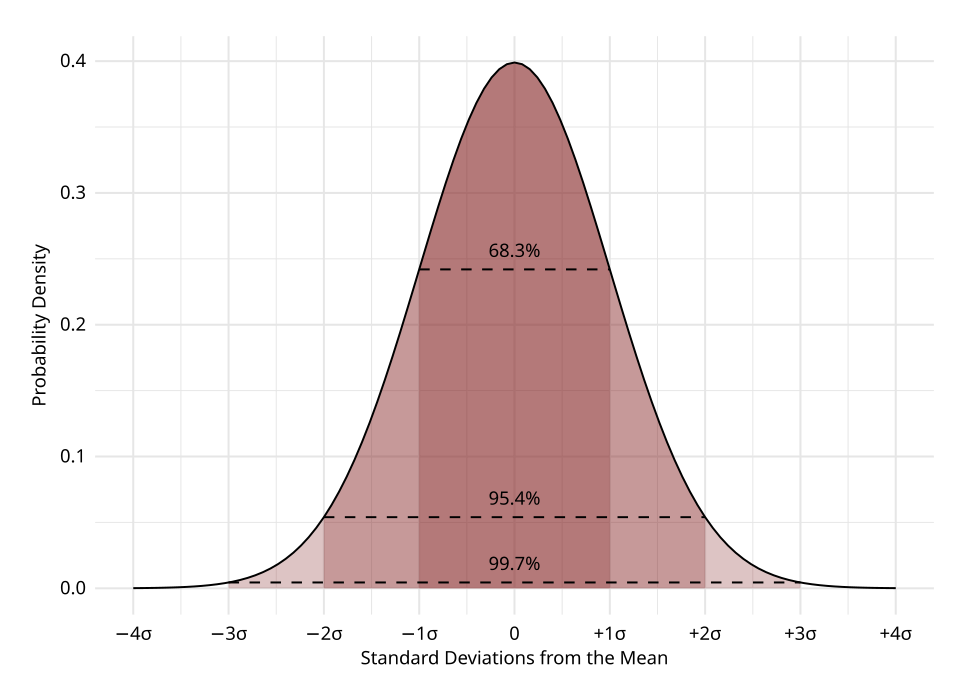
This standard normal curve shows the proportion of values within one, two, and three standard deviations of the mean. When applied to sampling distributions, these shaded areas represent the likelihood that the sample mean falls within corresponding numbers of standard errors. The 68–95–99.7 pattern provides a visual basis for interpreting normal probabilities. Source.
Role of Context in Interpretation
Context anchors all interpretation. A sampling distribution cannot be interpreted meaningfully without identifying:
The population being studied.
The variable measured.
The sample size used.
The unit associated with the measurement.
When interpreting the parameters or probabilities, students should restate these contextual details to show understanding of how the sampling distribution connects to the real situation. For instance, instead of stating that “the mean equals 50,” the interpretation should say that “the mean of the sampling distribution of the sample mean is 50 units, representing the long-run average of sample means for this population.”
Implications for Inference About the Population Mean
Interpreting a sampling distribution involves understanding how its parameters inform conclusions about the population mean. Key implications include:
A smaller standard deviation of the sampling distribution indicates more consistent sample means, strengthening confidence in estimates.
The equality of the sampling distribution mean and the population mean validates using as an unbiased estimator.
Knowledge of the distribution’s spread helps determine how unusual or typical a particular sample mean is.
Probability interpretations allow students to quantify how likely certain sample means are, which supports formal inference procedures.
Key Interpretive Practices for AP Statistics
To interpret sampling distributions effectively, students should use the following practices:
State all results with units that match the original variable.
Link every interpretation to the population context, not just the sample.
Emphasize the behavior of sample means, making clear distinctions from individual observations.
Use precise language, such as “in repeated random sampling,” to reflect the conceptual foundation of sampling distributions.
Interpret parameters before probabilities, ensuring understanding of the distribution’s structure before analyzing events within it.
FAQ
A sampling distribution describes how sample means vary across repeated samples, whereas a population distribution describes the values of individual observations.
The sampling distribution is always narrower than the population distribution when the sample size is greater than one, because averages vary less than individual data points.
Interpretation therefore focuses on long-run behaviour of sample means, not the behaviour of individual units in the population.
Probabilities in this context reflect the likelihood of obtaining particular sample means if many random samples were taken.
Individual observations follow the population distribution, which generally has a larger spread and does not describe the precision of estimates.
Using the correct level of distribution prevents misinterpretation, ensuring that probability statements align with repeated-sampling logic.
Context clarifies what the sample means represent and ensures that interpretations are grounded in real-world meaning.
Without contextual detail—such as units, the variable being measured, or the population involved—interpretations become vague or mathematically disconnected from the scenario.
Context also communicates the purpose of using sample means, such as estimating a population mean or assessing expected performance.
The standard deviation of the sampling distribution (standard error) reflects the reliability of sample means.
A smaller standard error suggests that most sample means will cluster tightly around the true population mean, indicating high precision.
A larger standard error signals greater variability in estimates, alerting analysts that the sampling method or sample size may need improvement.
Interpreting an observed mean relies on its distance from the centre of the sampling distribution.
Useful reasoning includes:
• Comparing the sample mean to the population mean in units of the standard error.
• Assessing whether it falls in the central cluster of likely values or in the extreme tails.
• Considering the sampling process to ensure no external factors influenced the result.
Practice Questions
Question 1 (1–3 marks)
A researcher records the time, in minutes, that customers spend in a shop. The population mean is 18 minutes with a population standard deviation of 6 minutes. A random sample of 40 customers is taken, and the researcher considers the sampling distribution of the sample mean.
Explain how the mean and standard deviation of this sampling distribution should be interpreted in context.
Question 1 (1–3 marks)
• 1 mark: States that the mean of the sampling distribution equals the population mean (18 minutes) and interprets it as the long-run average of sample means.
• 1 mark: States that the standard deviation of the sampling distribution is the population standard deviation divided by the square root of 40.
• 1 mark: Interprets the standard deviation in context as describing how much sample means are expected to vary from sample to sample.
Question 2 (4–6 marks)
A company produces energy bars, each with a true average weight of 52 grams and a population standard deviation of 4 grams. The quality control team takes repeated random samples of 25 bars and records the sample mean weight for each sample.
(a) State the mean and standard deviation of the sampling distribution of the sample mean.
(b) A supervisor claims that “most sample means should fall fairly close to 52 grams.” Use the sampling distribution to justify whether this statement is reasonable.
(c) The team obtains a single sample mean of 48 grams. Explain, using interpretation of the sampling distribution, why this sample mean may be considered unusual.
Question 2 (4–6 marks)
Part (a)
• 1 mark: States that the mean of the sampling distribution is 52 grams.
• 1 mark: Correctly computes the standard deviation of the sampling distribution as 4 divided by the square root of 25 (that is, 0.8 grams).
Part (b)
• 1 mark: States that the sampling distribution is centred at 52 grams.
• 1 mark: Explains that most sample means will fall within a small number of standard errors (for example, within one or two), meaning they will be close to 52 grams.
Part (c)
• 1–2 marks: Explains that 48 grams is several standard errors below the mean (four standard errors in this case), making it far from the centre of the sampling distribution.
• 1 mark: Concludes that this makes the result unusual or unlikely in repeated random sampling.
