
AP Syllabus focus:
‘Instruction on calculating the standard error of p-hat as sqrt[(p-hat(1-p-hat))/n], which estimates the standard deviation of the sampling distribution of the sample proportion and is fundamental in determining the margin of error.’
Understanding how to calculate the standard error of a sample proportion is essential because it quantifies expected sampling variability and forms the foundation for constructing accurate confidence intervals.
Calculating the Standard Error of a Sample Proportion
The standard error of a sample proportion measures how much the sample proportion (p-hat) is expected to vary across repeated random samples of the same size. This subsubtopic focuses on interpreting the standard error as an estimate of the standard deviation of the sampling distribution of p-hat, using the formula provided in the specification.
The Role of Standard Error in Statistical Inference
The standard error is a critical component in estimating population proportions because it directly influences the margin of error and, therefore, the width of a confidence interval. A smaller standard error indicates more precise estimates of the population proportion, while a larger standard error signals greater sampling variability. Understanding this measure helps justify why some intervals are narrower or wider depending on sample characteristics.
Understanding p-hat and Its Variability
A sample proportion (p-hat) represents the proportion of individuals in a sample who fall into a specified category. Because each randomly selected sample will differ slightly, p-hat naturally varies from sample to sample. The standard error formalizes this variation in a predictable way based on probability theory.
Sample Proportion (p-hat): The ratio of individuals in a sample exhibiting a particular categorical outcome to the total sample size.
This measure provides a single summary figure but does not alone express how much variation to expect across repeated samples. That expectation is captured through the standard error.
Deriving the Standard Error Formula
The standard error of p-hat is based on the theoretical structure of the sampling distribution of a proportion. When the sample size is sufficiently large, this distribution becomes approximately normal due to the Central Limit Theorem applied to proportions. This approximation allows us to estimate the standard deviation of p-hat using only the sample proportion and the sample size.
EQUATION
= Sample proportion (unitless)
= Sample size (number of observations)
A standard sentence is necessary here to continue the flow of explanation before any additional technical details are introduced. This helps reinforce the conceptual purpose of the formula within inferential procedures.
Why p-hat Appears in the Formula
The use of p-hat in the standard error reflects that we rarely know the population proportion, p, in real-world situations. Because inference aims to estimate unknown population parameters, the sample proportion serves as a practical substitute. Using p-hat provides a reasonable and unbiased initial approximation, especially when sample sizes meet validity conditions for inference.
The Connection to the Sampling Distribution
The standard error represents the estimated standard deviation of the sampling distribution of p-hat.
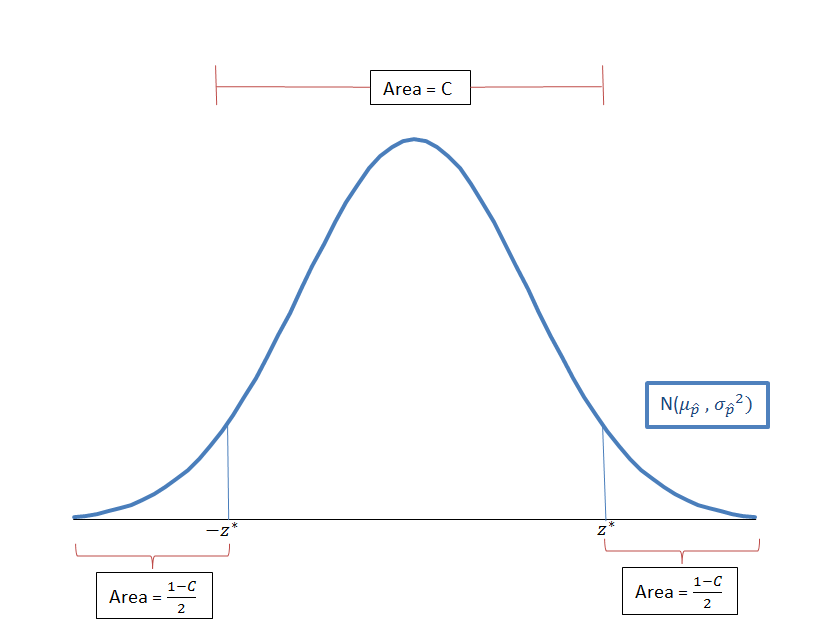
A normal curve representing the sampling distribution of sample proportions, centered at the population proportion. The spread of the curve reflects the standard error of p-hat, showing how sampling variability changes with sample size. This visual reinforces that the standard error functions as the standard deviation of the sampling distribution. Source.
This distribution describes all possible sample proportions that could be obtained from repeated random samples. The standard deviation of this distribution indicates typical sampling variation. Since the true standard deviation depends on the unknown population proportion, the formula substitutes p-hat to make the estimate feasible.
Conditions Underlying the Standard Error Formula
The validity of the standard error calculation depends on meeting required conditions for approximate normality of the sampling distribution. These conditions ensure that the formula provides a reliable estimate of sampling variability and supports later steps such as constructing confidence intervals.
These conditions include:
Independence
Data must arise from random sampling or a randomized experiment.
When sampling without replacement, the 10% condition must be met to limit dependence among observations.
Sample size adequacy
Both and must be at least 10.
This ensures that the sampling distribution of p-hat is approximately normal, supporting the standard error calculation.
Each requirement ensures that the approximation embedded in the formula faithfully represents true sampling variability.
How Standard Error Influences Margin of Error
Although this subsubtopic focuses strictly on calculating the standard error, its significance lies in its role in the margin of error. Because the margin of error scales directly with the standard error, understanding and correctly computing this value is fundamental to all inference procedures involving population proportions. A larger standard error results in a broader interval, while a smaller one yields tighter, more precise estimates.
Interpreting the Standard Error in Context
The standard error should always be interpreted within the context of the study. It represents how much variation in p-hat would be expected if many samples were repeatedly drawn under identical conditions. This interpretation anchors the formula in real-world reasoning rather than abstract mathematics. By quantifying expected sampling variability, the standard error helps connect sample results to the broader population and supports statistically justified inference.
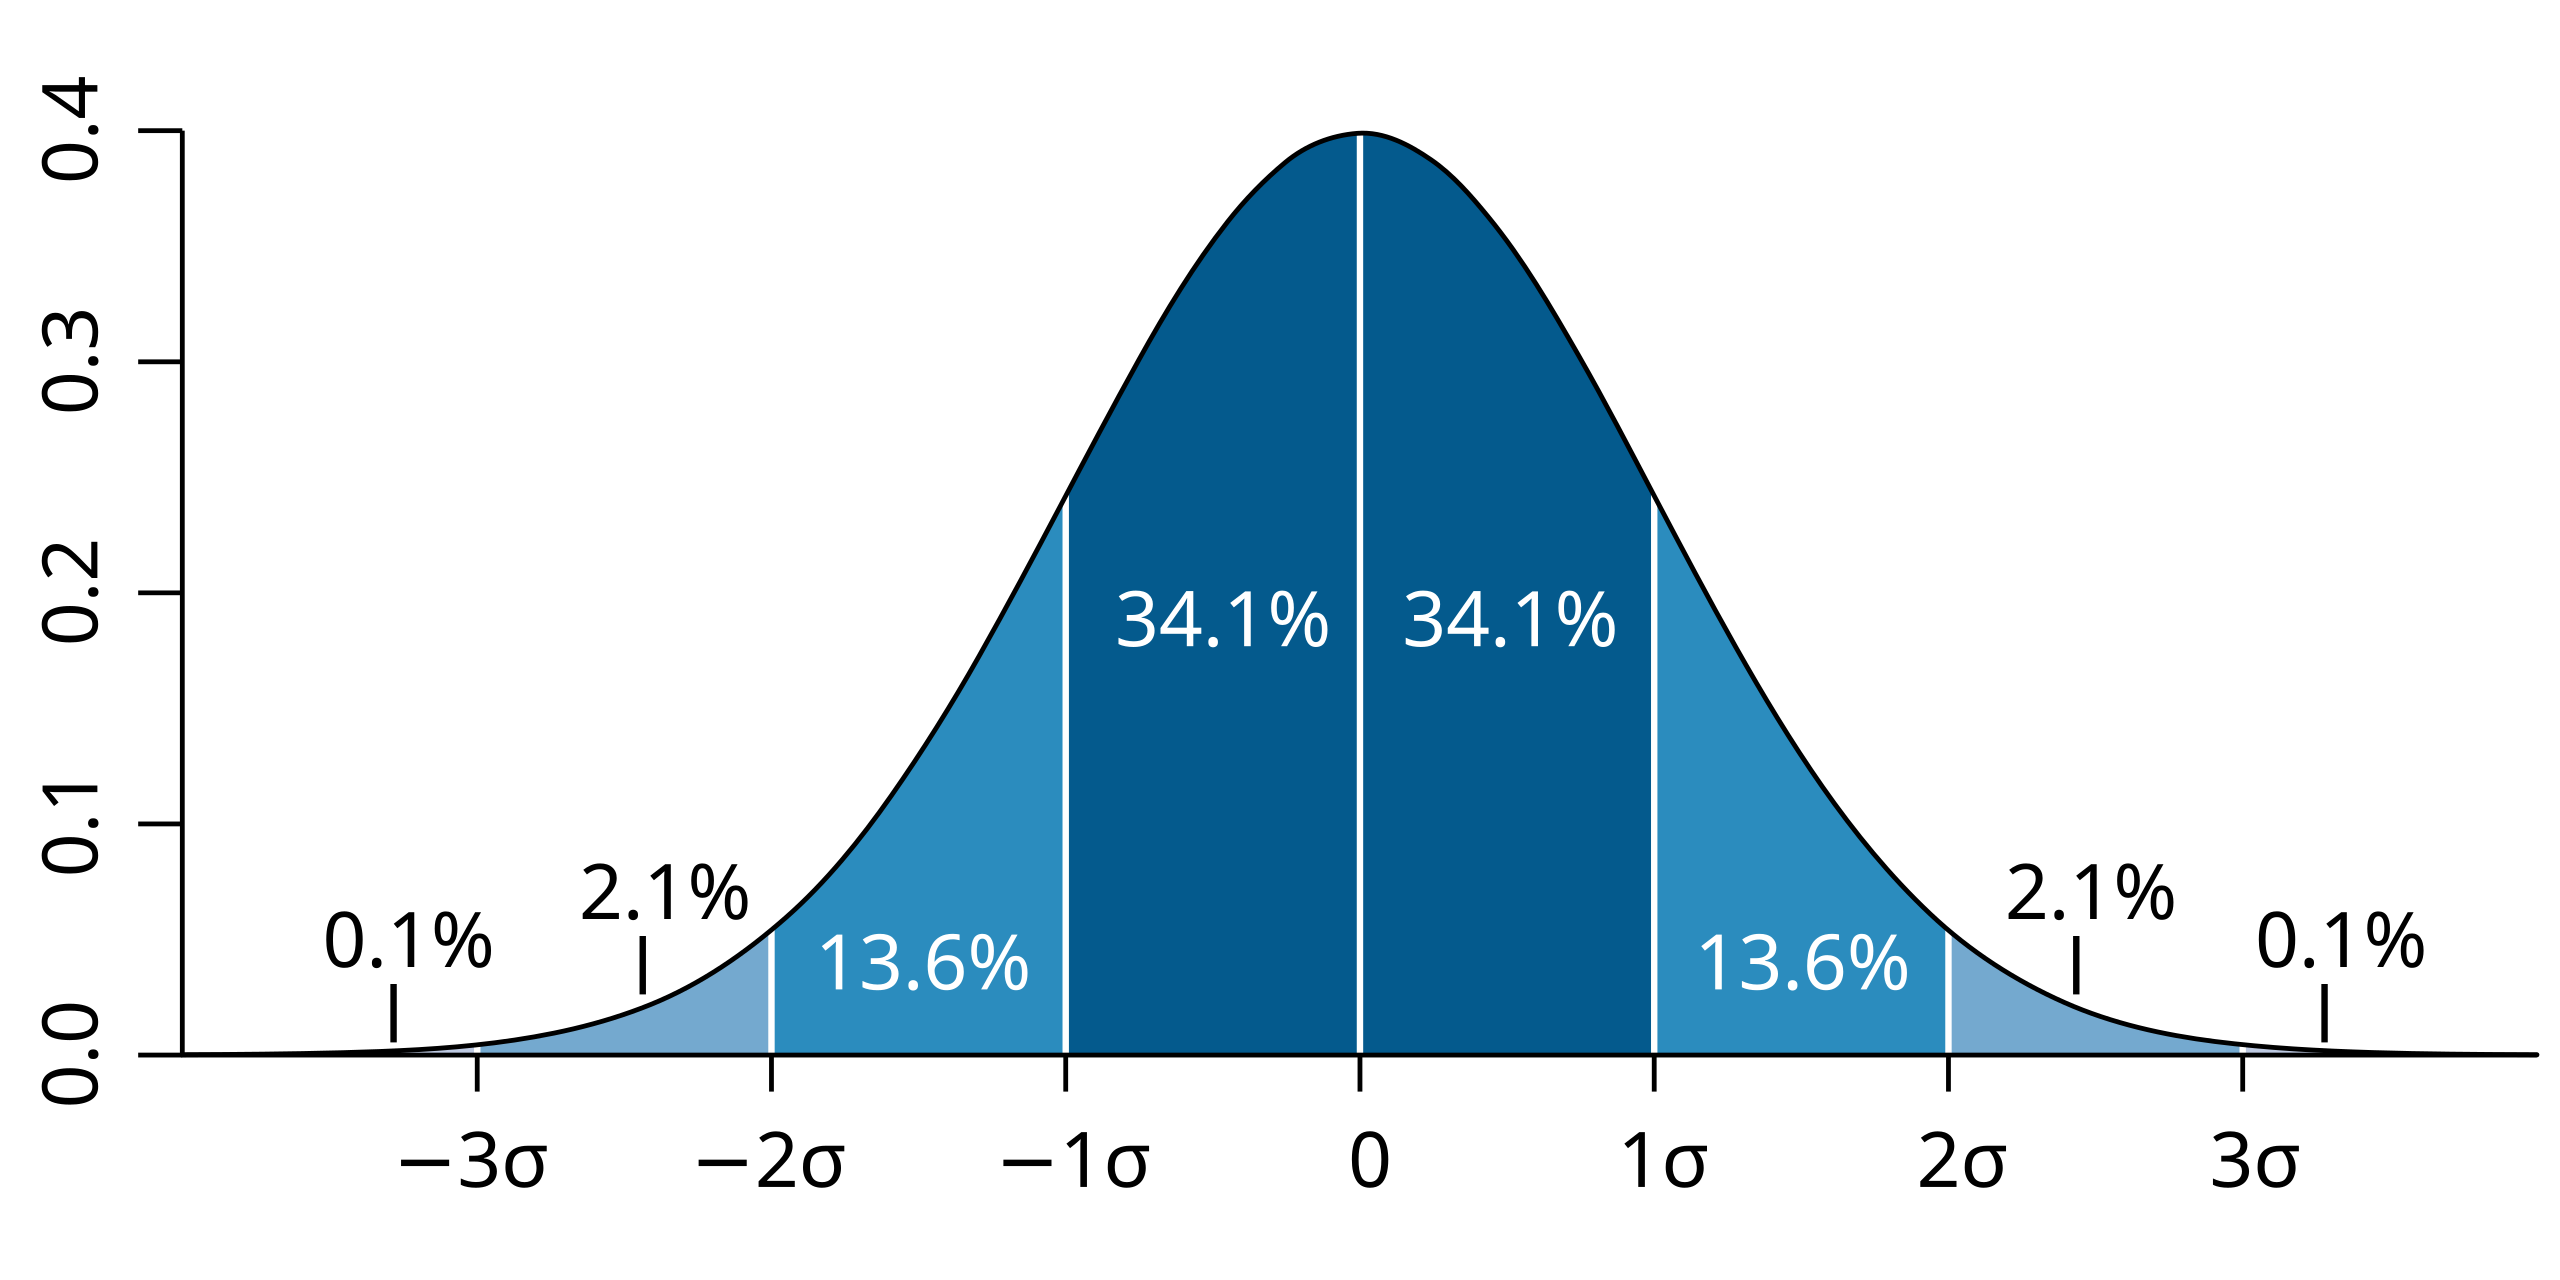
A normal distribution divided into standard deviation intervals demonstrates how spread is measured around the mean. The highlighted bands show that most values fall within one or two standard deviations, illustrating the concept of typical variability. These percentages extend beyond syllabus requirements but effectively support the interpretation of standard deviation and, by analogy, standard error. Source.
FAQ
The standard error depends on p-hat multiplied by (1 − p-hat). This product is largest when p-hat is 0.5 and becomes smaller as p-hat approaches either extreme.
This means proportions near 0 or 1 naturally produce less sampling variability because there is less uncertainty about the category outcome. In practical terms, highly skewed proportions tend to yield tighter sampling distributions.
A larger sample size not only reduces the standard error but also stabilises p-hat, making it less sensitive to random fluctuations.
In addition:
• The sampling distribution becomes more closely approximated by a normal distribution.
• Estimates become more consistent across repeated samples.
• Confidence interval widths shrink at a predictable rate.
The true population proportion is typically unknown, which is precisely why inference is being conducted. Using p-hat provides an estimate based on available data.
Replacing p with p-hat is reasonable because p-hat is the best unbiased estimate of the true proportion. As sample size increases, p-hat becomes an increasingly accurate substitute, making the estimated standard error more dependable.
If the sample is not random, the standard error may underestimate or misrepresent true variability because it assumes randomness and independence.
Consequences may include:
• Bias in p-hat, making the standard error irrelevant.
• Incorrect confidence intervals, often too narrow.
• Overstated precision, leading to misleading conclusions.
Yes. The standard error depends on both p-hat and the sample size. Two studies may observe the same p-hat but differ in sample size, producing different levels of variability.
A larger sample size will always yield a smaller standard error when p-hat is the same. This distinction is crucial when comparing results across studies or assessing reliability.
Practice Questions
Question 1 (1–3 marks)
A random sample of 180 customers at a café found that 54 of them purchased a vegan menu item.
(a) Calculate the sample proportion, p-hat.
(b) Using this value, compute the standard error of p-hat.
(Give your answer to three decimal places.)
Question 1
(a) 1 mark
• Correctly states p-hat = 54/180 = 0.30. (1)
(b) 2 marks
• Substitutes values correctly into the standard error formula: sqrt(0.30 × 0.70 / 180). (1)
• Calculates the correct standard error: 0.034 (accept answers between 0.033–0.035). (1)
Total: 3 marks
Question 2 (4–6 marks)
A school is studying the proportion of students who cycle to school at least three times per week.
A random sample of 250 students shows that 70 meet this criterion.
(a) State the sample proportion, p-hat.
(b) Explain why it is appropriate to use the standard error formula for a sample proportion in this context.
(c) Calculate the standard error of p-hat.
(d) Interpret the standard error in the context of the study.
Question 2
(a) 1 mark
• Correctly states p-hat = 70/250 = 0.28. (1)
(b) 2 marks
• Mentions independence: random sample or data reasonably treated as independent. (1)
• Mentions normality condition: n p-hat and n(1 − p-hat) are both at least 10. (1)
(c) 1 mark
• Correctly calculates standard error: sqrt(0.28 × 0.72 / 250) = 0.028 (accept 0.027–0.029). (1)
(d) 2 marks
• States that the standard error represents the typical variation in sample proportions across repeated samples. (1)
• Contextualises: here, it shows how much the sample proportion of students who cycle regularly would vary from sample to sample. (1)
Total: 6 marks
