
AP Syllabus focus:
‘Detailed process for computing the margin of error using the formula z* * sqrt[(p-hat(1-p-hat))/n], which represents how much the sample proportion is expected to vary from the true population proportion.’
The margin of error quantifies expected sampling variability when estimating a population proportion. It uses the critical value and standard error to construct an interval estimate.
Computing the Margin of Error
The margin of error is a central idea in constructing a one-sample confidence interval for a population proportion. It measures how far the sample proportion might reasonably fall from the true population proportion, assuming proper conditions for inference are met. This subsubtopic focuses specifically on how to compute the margin of error once the standard error has been established and the confidence level has been chosen. Because the margin of error incorporates both sampling variability and the level of certainty desired, understanding its components strengthens a student’s ability to make sound statistical inferences.
The Role of Sampling Variability
The margin of error reflects the expected variation in from sample to sample. This variation arises because each random sample may include slightly different outcomes, even when drawn from the same population. The margin of error formalizes this variability by combining the estimated spread of the sampling distribution with the critical value, which indicates the degree of confidence required.
Key Components of the Computation
Two quantities must be available before the margin of error can be computed:
Sample proportion , which serves as the point estimate.
Critical value , obtained from the standard normal distribution and associated with a selected confidence level.
A third component, the standard error, provides the estimated standard deviation of the sampling distribution of . Although computed in a previous step of the interval procedure, it remains essential in determining the margin of error for a population proportion.
Definition of the Margin of Error
Margin of Error: A measure of the maximum expected difference between the sample proportion and the true population proportion at a chosen confidence level.
After defining the concept, it is important to note that the magnitude of the margin of error depends on both the confidence level and the amount of variability present in the sample data.
Formula for the Margin of Error
The formula used in this subsubtopic stems directly from the combination of the critical value and the standard error of the sample proportion.
EQUATION
= Critical value from the standard normal distribution associated with the confidence level
= Sample proportion (number of successes divided by sample size)
= Sample size (count of observations used to estimate the proportion)
This equation shows that the margin of error is scaled by the level of confidence (through ) and shaped by the sample’s estimated variability (through and ).
A sentence is required between equation blocks, and this one explains that the equation links theoretical distributional properties with practical sample information, ensuring proper interpretation.
For a chosen confidence level C, the critical value comes from the standard normal distribution and tells us how many standard errors to move away from the center.
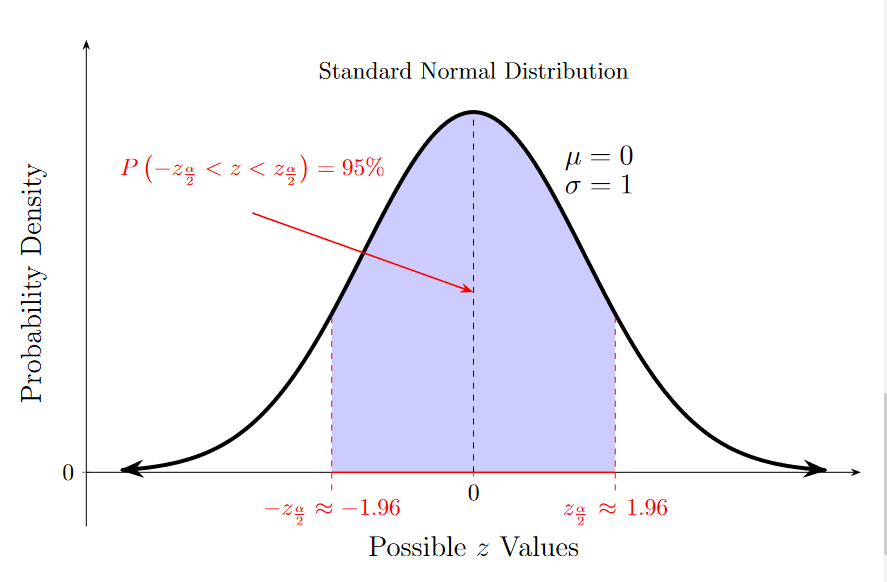
The standard normal curve shows the central 95% of z-scores between −1.96 and 1.96, illustrating how confidence levels determine the critical value used in margin-of-error calculations. Source.
How the Formula Reflects Sampling Behavior
Because the expression models the estimated spread of all possible sample proportions, multiplying it by the critical value broadens or narrows the range around based on how confident the analyst wants to be. Larger critical values create wider margins of error, signifying the need for more certainty. Smaller critical values reduce the margin, indicating more tolerance for uncertainty.
Factors That Change the Margin of Error
When analyzing how the margin of error behaves, consider how each component contributes:
Confidence level:
Higher levels (e.g., 99%) increase , producing a larger margin of error.
Lower levels (e.g., 90%) decrease , producing a smaller one.
Sample size ():
A larger sample size reduces the standard error and therefore reduces the margin of error.
A smaller sample size increases the standard error, widening the margin.
Sample proportion ():
When is near 0.5, variability is largest, resulting in a wider margin.
When is near 0 or 1, variability is smaller, narrowing the margin.
Interpreting the Margin of Error
The margin of error expresses the radius of the confidence interval centered at . It represents how much the sample proportion might reasonably differ from the true population proportion due to random sampling error. Because it directly influences the width of the interval, understanding the margin of error is essential for evaluating the precision of an estimate.
The margin of error describes how far we expect the sample proportion to fall from the true population proportion p when the normal model for the sampling distribution is appropriate.
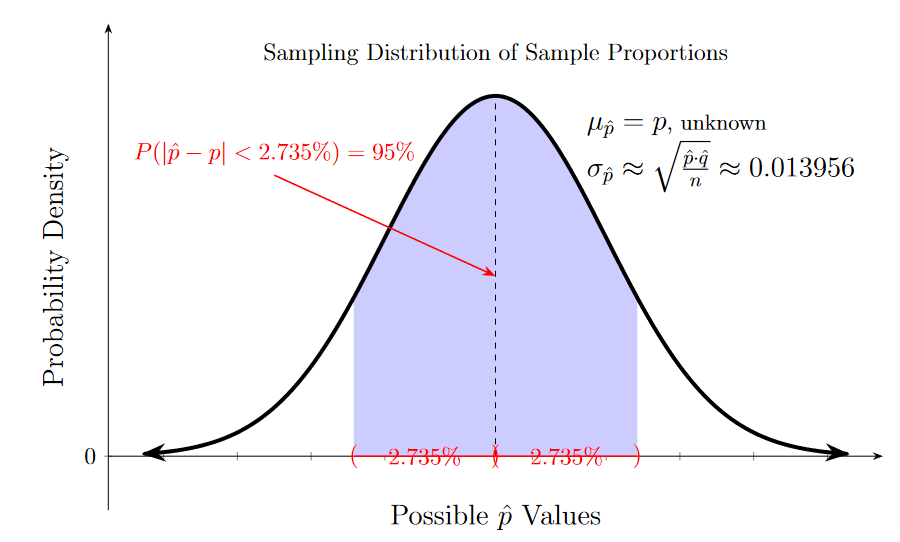
The sampling distribution diagram highlights the central region around the true proportion, showing how the margin of error bounds the range of typical sample proportions. Source.
Process Summary for Computing the Margin of Error
Identify the sample proportion .
Confirm the confidence level and determine from the standard normal distribution.
Calculate the standard error .
Multiply the critical value and the standard error to obtain the margin of error.
Use the margin of error in constructing a confidence interval for a population proportion.
Increasing the confidence level (and therefore using a larger ) makes the margin of error larger, while increasing the sample size n makes the margin of error smaller.
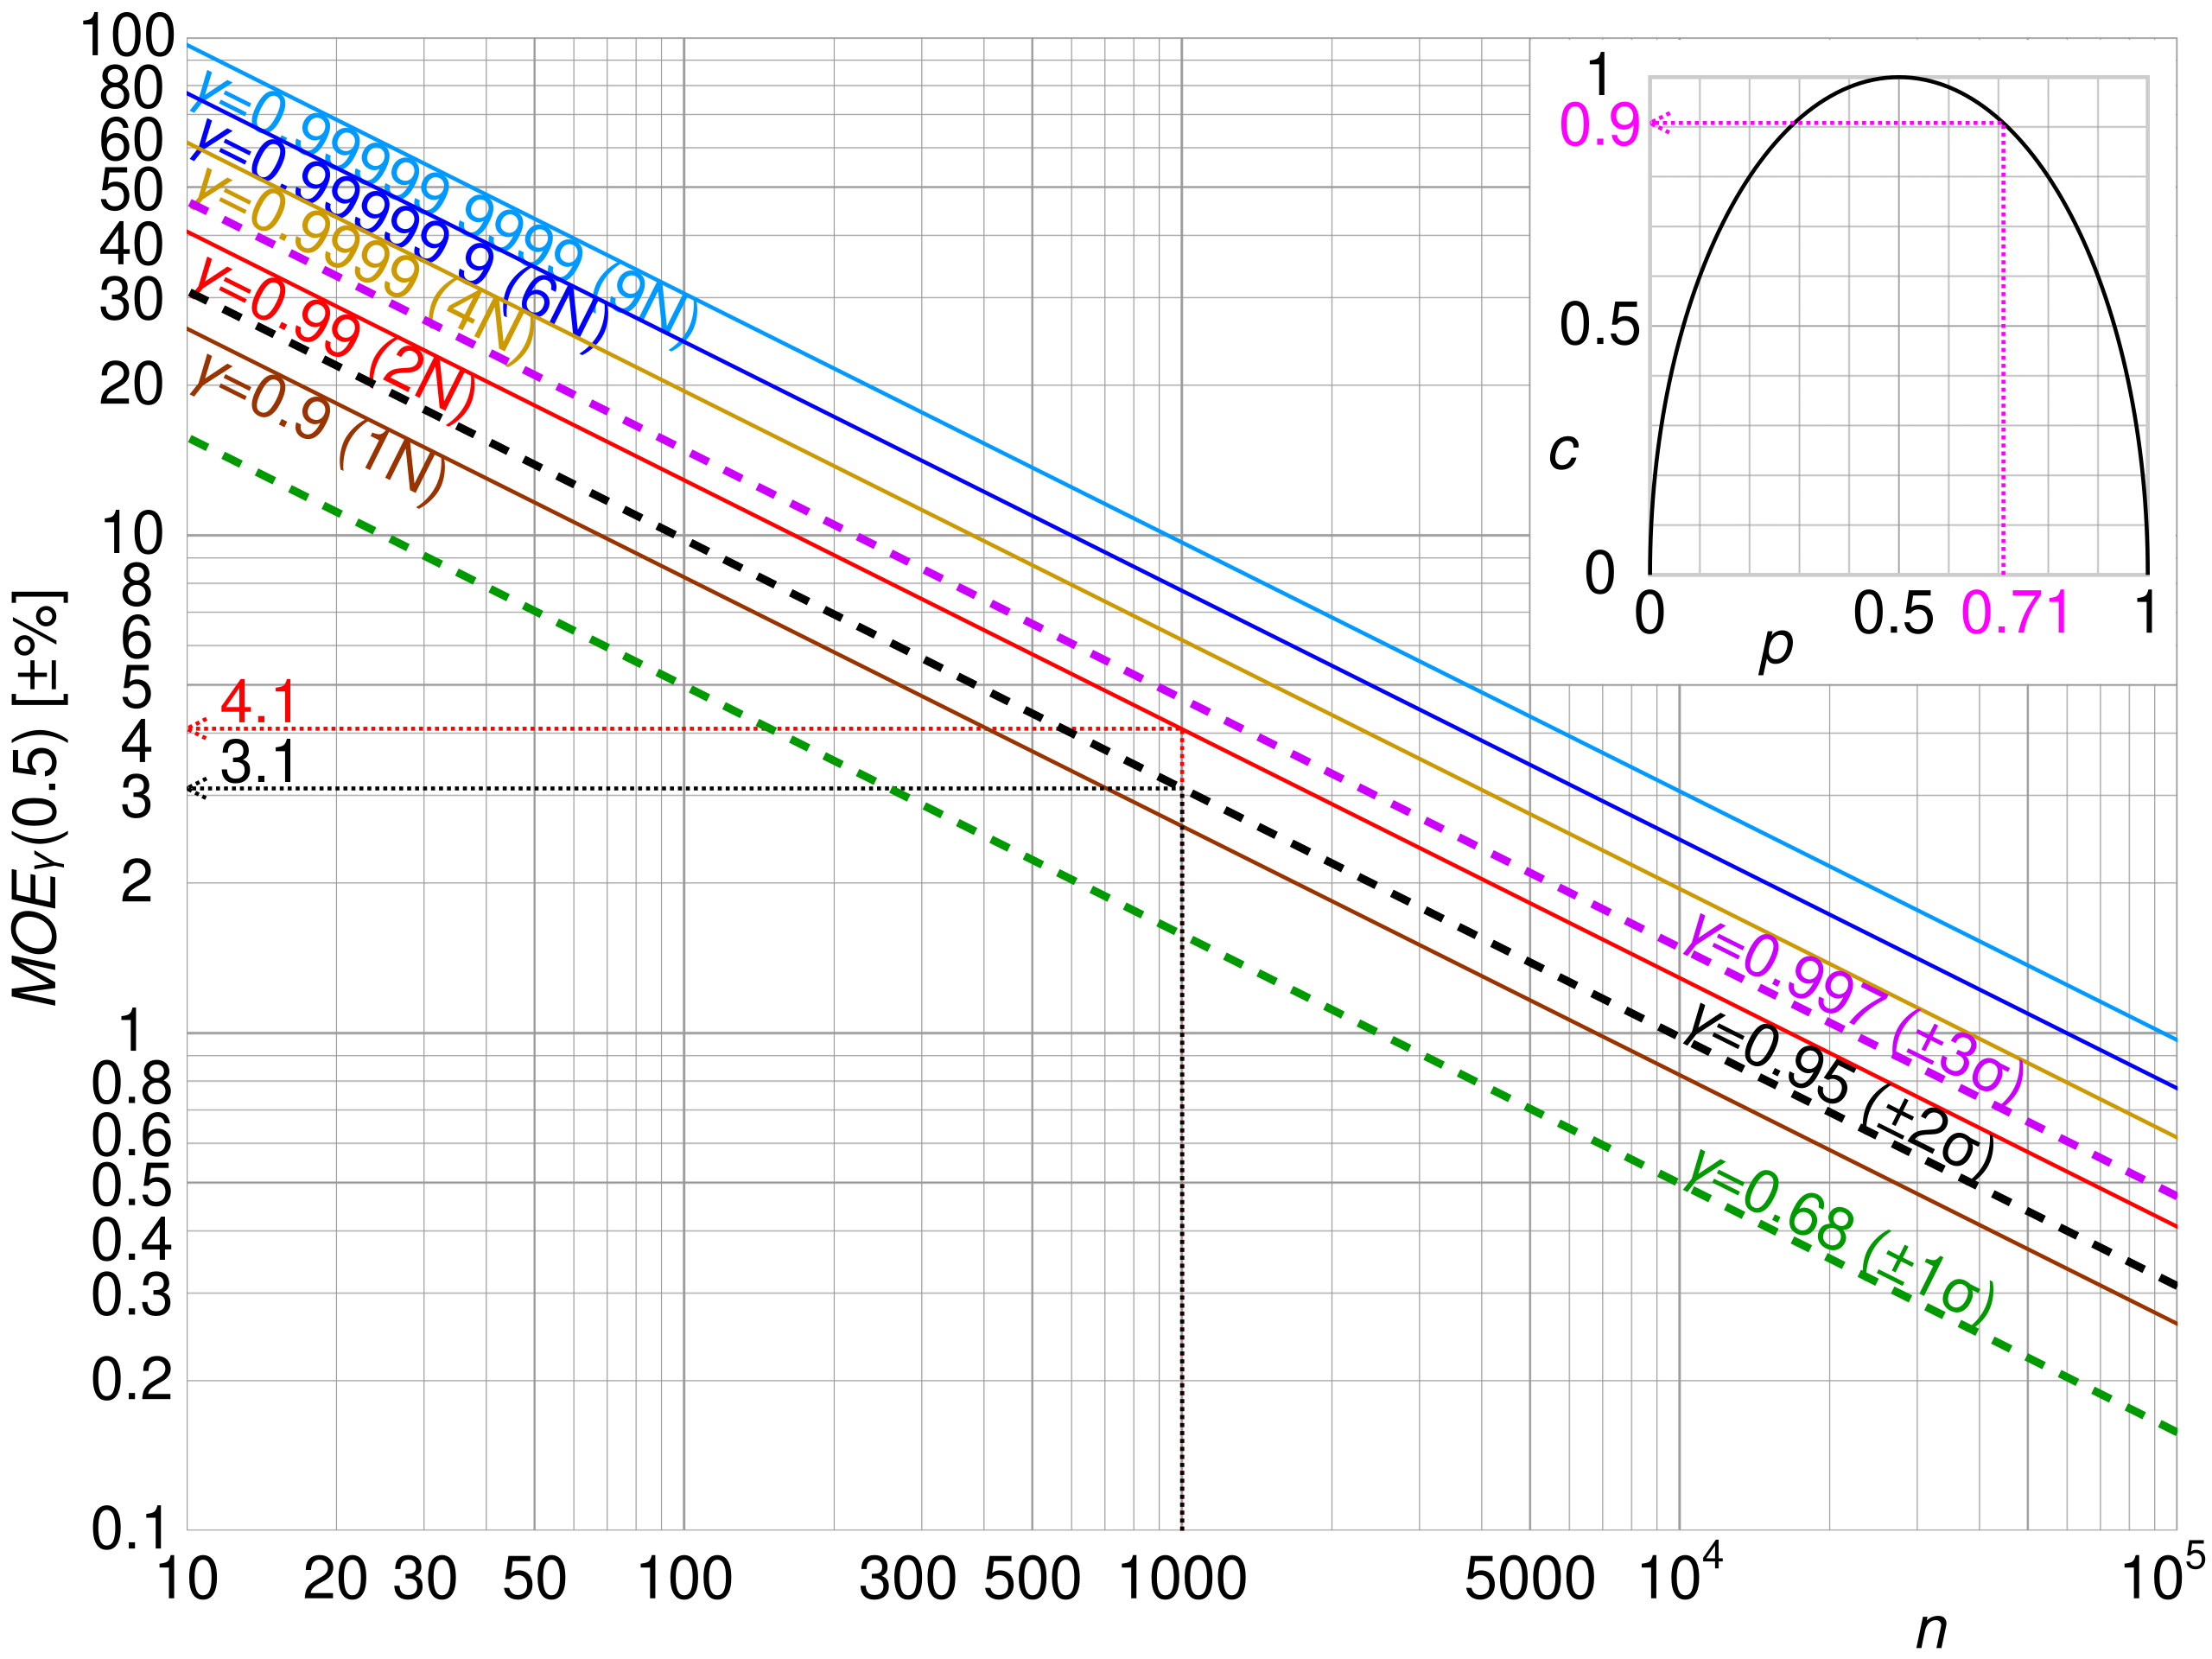
This multi-curve plot shows how the margin of error decreases with larger sample sizes and increases with higher confidence levels, reinforcing the relationship described in the text. Source.
FAQ
When the sample proportion is near 0 or 1, the product p-hat multiplied by (1 − p-hat) becomes very small, reducing the standard error and therefore the margin of error.
This means confidence intervals tend to be narrower when the observed proportion is extreme, even if the sample size and confidence level remain unchanged.
However, very small or very large proportions may also raise concerns about whether the normal approximation is appropriate, especially if np-hat or n(1 − p-hat) is close to the minimum threshold.
The standard error shows the typical sampling variation of the sample proportion, but by itself it only reflects variation within one standard deviation of the sampling distribution.
Multiplying by the critical value stretches this variation to cover a chosen percentage of all possible samples.
This converts ordinary sampling variability into a confidence-based bound that determines how wide an interval must be to achieve the selected level of certainty.
The confidence level only affects the critical value, but this change has a meaningful impact on interpretation.
Higher confidence levels lead to larger critical values, which widen the margin of error and produce broader confidence intervals.
Lower confidence levels shrink the critical value, narrowing the margin of error and creating tighter intervals but with less certainty that the true proportion is captured.
A larger sample size reduces the standard error because proportions calculated from larger samples fluctuate less between repeated samples.
This reduction in sampling variability directly lowers the margin of error, even when p-hat does not change.
In practice, doubling the sample size does not halve the margin of error, but it does create a meaningful improvement in precision.
Yes. If the normal approximation is not justified, the margin of error may be misleading.
This commonly occurs when np-hat or n(1 − p-hat) is too small to support an approximately normal sampling distribution.
In such cases, alternative interval estimators may be more suitable, though these fall outside the scope of this specific subsubtopic.
Practice Questions
Question 1 (1–3 marks)
A survey of 200 students finds that 58% support extending library opening hours. The school wishes to construct a 95% confidence interval for the true proportion of students who support the change.
Using a critical value of 1.96, calculate the margin of error for this confidence interval. Give your answer to three decimal places.
Question 1 (1–3 marks)
• 1 mark: Correct substitution into the margin of error formula using 0.58 and 200.
• 1 mark: Correct computation of the standard error: sqrt[0.58 × 0.42 / 200].
• 1 mark: Correct final margin of error using 1.96 multiplied by the standard error (accept answers rounded to three decimal places).
Question 2 (4–6 marks)
A market research company surveys a random sample of 500 consumers and finds that 41% prefer a new product design. The company plans to report a 90% confidence interval for the true proportion of all consumers who prefer the new design.
(a) Explain the meaning of the margin of error in this context.
(b) Calculate the margin of error using a 90% critical value of 1.645.
(c) Comment on how the margin of error would change if the company increased the sample size to 800 while keeping the confidence level the same.
Question 2 (4–6 marks)
(a) (1–2 marks)
• 1 mark: States that the margin of error represents how far the sample proportion may reasonably differ from the true population proportion.
• 1 mark: Provides context, referring specifically to consumers' preference for the new product design.
(b) (2–3 marks)
• 1 mark: Correct substitution into the margin of error formula using 0.41 and 500.
• 1 mark: Correct computation of the standard error: sqrt[0.41 × 0.59 / 500].
• 1 mark: Correct multiplication by the critical value 1.645 to give the margin of error (accept reasonable rounding).
(c) (1 mark)
• 1 mark: States that the margin of error would decrease because a larger sample size reduces the standard error.
