
AP Syllabus focus:
‘Method for calculating the minimum required sample size (n) to achieve a specified margin of error, discussing the rearrangement of the margin of error formula and the selection of an initial p-hat value for the calculation, often p-hat = 0.5 for maximum sample size estimation.’
Sample Size Calculation for Desired Margin of Error
A well-chosen sample size enables a confidence interval to meet a desired margin of error, ensuring the estimate of a population proportion is sufficiently precise for inference.
This diagram shows a confidence interval centered on an estimate, with the margin of error illustrated as the distance from the center to each endpoint. It helps visualize the structure of “estimate ± margin of error,” a key idea in planning sample size. Any specific numerical example shown is not part of the required syllabus content. Source.
Understanding Why Sample Size Matters
Determining sample size is a forward-looking process: instead of collecting data and then computing a margin of error, statisticians often start by choosing the desired margin of error, confidence level, and an estimate of the population proportion, and then calculate the minimum sample size needed to meet those goals.
When constructing a one-sample z-interval for a population proportion, the margin of error is influenced by the critical value, the sample proportion, and the sample size. Planning an adequate sample size ensures that the resulting interval is neither unnecessarily wide nor inefficiently narrow.
Key Components in Sample Size Determination
Before rearranging the margin of error formula, it is essential to understand each of its components and their roles in controlling the precision of a confidence interval.
Margin of Error: The maximum expected difference between the sample proportion and the true population proportion for a given confidence level.
The next step is to express how the margin of error is mathematically connected to sample size, the underlying structure that guides sample size planning.
EQUATION
= Standard normal critical value corresponding to the chosen confidence level
= Estimated population proportion
= Sample size
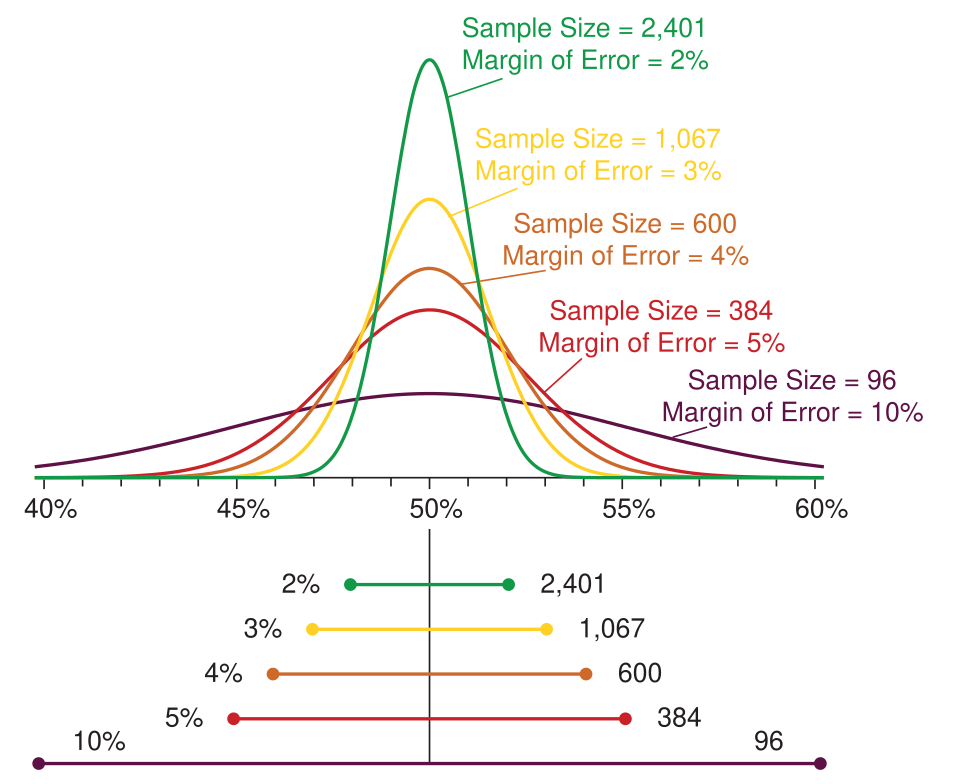
This relationship shows that the margin of error decreases as the sample size increases, holding all other factors constant.
This graph illustrates how the margin of error shrinks as sample size grows and increases with higher confidence levels. It reinforces the inverse relationship between sample size and margin of error and the effect of choosing different critical values. The multi-curve detail exceeds AP depth, but the overall trends are the key focus. Source.
A sentence here ensures appropriate spacing before the next concept.
Choosing an Estimate for the Population Proportion
Because the true population proportion is unknown before data collection, an estimate of p-hat must be selected when calculating sample size. The AP syllabus emphasizes that choosing p-hat = 0.5 is often recommended because it maximizes the product p-hat(1 − p-hat), producing the largest possible required sample size. This conservative estimate guarantees that the achieved margin of error will not exceed the desired threshold, regardless of the actual proportion.
To summarize the role of the initial estimate:
Using prior data or pilot studies may give a more accurate value of p-hat.
Using p-hat = 0.5 is safest when no prior information exists.
Larger values of p-hat(1 − p-hat) increase required sample size, ensuring adequate precision.
Rearranging the Margin of Error Formula
The central step in sample size determination is algebraically solving the margin of error expression for n. This reversal of the usual confidence interval process allows researchers to set the expected accuracy in advance.
EQUATION
= Minimum required sample size
= Desired maximum difference between sample and population proportion
Because n must represent a whole number of observations, the calculated value is always rounded up to ensure the achieved margin of error does not exceed the desired bound.
A normal sentence here ensures spacing after the equation block.
Steps for Determining the Minimum Required Sample Size
The process of calculating sample size for a desired margin of error follows a clear sequence. Each step ensures that the planned study can support a properly constructed z-interval for a population proportion.
Step 1: Select the Desired Margin of Error
The margin of error expresses the allowed deviation between the sample proportion and the true population proportion. Smaller margins require larger samples.
Step 2: Choose a Confidence Level
The confidence level determines the corresponding critical value z*. Common levels include 90%, 95%, and 99%, each producing a different degree of certainty.
Step 3: Estimate the Proportion
Select an estimate of p-hat using one of the following:
A pilot study proportion
A previously known estimate
0.5, recommended when no estimate exists
Step 4: Substitute Values Into the Rearranged Formula
Plug the chosen margin of error, estimated proportion, and critical value into the equation for n.
Step 5: Round the Result Up
Because a fractional sample is impossible, the final value of n must be rounded up to the nearest whole number.
Additional Considerations in Sample Size Planning
Larger sample sizes reduce variability, producing more stable estimates of the population proportion.
Practical constraints, such as cost and time, must be balanced against the desired precision of the confidence interval.
Using the conservative estimate of p-hat = 0.5 ensures that the selected sample size will always meet or exceed requirements.
How This Process Supports Statistical Inference
Accurate sample size planning is foundational to constructing meaningful confidence intervals. By controlling the margin of error in advance, researchers ensure that the final interval estimate meets the desired standards of precision and interpretability.
FAQ
A very small margin of error forces the sample size to grow rapidly because the margin of error decreases in proportion to the square root of the sample size.
In practice, this can make data collection costly or infeasible.
Researchers often reassess whether such precision is necessary or whether a slightly larger margin of error still produces useful results.
Adjusting the sample size mid-study is generally discouraged because it can introduce bias and compromise the randomness of the final sample.
A second, separately planned study may be conducted if the obtained margin of error is larger than desired.
Any adjustment must be justified and implemented without influencing which individuals are included.
The normal approximation ensures that the z-based confidence interval behaves as expected. For this to hold, the expected counts of successes and failures must be sufficiently large.
If the sample size is too small for the approximation, the confidence interval may not achieve the stated confidence level, making the calculated sample size unreliable.
Higher confidence levels require larger critical values, which directly inflate the required sample size.
Researchers balance:
• The need for strong certainty
• Available resources
• The practicality of recruiting participants
A lower confidence level may be acceptable when resources are limited, provided the reduced certainty is acknowledged.
Yes. Populations with substantial variation in characteristics relevant to the proportion may produce sample proportions that fluctuate more widely.
If no reliable pilot data exist for a heterogeneous population, using p-hat = 0.5 becomes especially important to guard against underestimating the required sample size.
Practice Questions
A researcher wishes to estimate the proportion of adults in a city who support a new recycling initiative. The researcher wants the margin of error of the 95% confidence interval to be no more than 0.04. With no prior estimate of the population proportion, what minimum sample size should be used?
Question 1 (1–3 marks)
• Correct use of p-hat = 0.5 when no prior estimate is available: 1 mark
• Substitution of values into the sample size formula (margin of error = 0.04, z* for 95% confidence = 1.96): 1 mark
• Correct minimum sample size, rounded up to the nearest whole number (approximately 601): 1 mark
A public health department plans a survey to estimate the proportion of residents who have received a seasonal flu vaccine.
The department requires a margin of error no greater than 0.03 for a 95% confidence interval.
A pilot study suggests that approximately 62% of residents have been vaccinated.
(a) Using the pilot estimate, calculate the minimum sample size required.
(b) Explain why using 0.5 instead of the pilot estimate would produce a more conservative sample size.
(c) State one practical limitation the department might face when selecting the larger conservative sample size.
Question 2 (4–6 marks)
(a)
• Use of p-hat = 0.62 from the pilot study: 1 mark
• Correct substitution into the sample size formula: 1 mark
• Correct numerical answer, rounded up (approximately 1,041): 1 mark
(b)
• Explanation that 0.5 maximises p-hat(1 – p-hat), leading to the largest possible required sample size: 1 mark
(c)
• Identifying a reasonable practical limitation (for example, cost, time, difficulty contacting residents, limited staffing): 1 mark
• Clear and coherent reasoning throughout: 1 mark
