
AP Syllabus focus:
'Independence condition: The sample data must be collected through a random process (random sampling or randomized experiment), and when sampling without replacement, the sample size should not exceed 10% of the population. - Normality condition: Assuming the null hypothesis is true, the expected number of successes (np0) and failures [n(1 - p0)] in the sample should both be at least 10 to ensure the sampling distribution of the sample proportion (p-hat) is approximately normal.'
In significance tests for a population proportion, we cannot blindly apply formulas; we must first verify key conditions so our inferences are valid and trustworthy.
Verifying Conditions for Statistical Inferences
When conducting a one-sample z-test for a population proportion, you are using a normal-model approximation to describe the sampling distribution of the sample proportion . This approximation is not automatically valid for every data set. The AP syllabus emphasizes two essential checks before proceeding with inference: the independence condition and the normality condition. Together, these conditions justify using a z-test and interpreting the resulting p-value as meaningful evidence about the population proportion.
Independence Condition: Random Process and the 10% Guideline
The independence condition focuses on how the data were produced. Statistical formulas for standard error and null distributions assume that each observation in the sample behaves as if it does not influence any other observation.
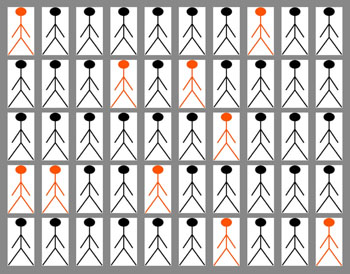
This figure shows a population of individuals, with 10 randomly selected subjects highlighted in a different color to represent a simple random sample. It emphasizes that every member of the population had an equal chance to be chosen, supporting the independence condition used in one-sample z-tests for a proportion. The health-research context in the surrounding text is extra, but the image itself focuses solely on the basic idea of simple random sampling. Source.
Independent observations: A set of observations is independent if knowing the value of one observation does not give information about the value of another.
In practice, we do not usually check independence by examining individuals one by one. Instead, we examine the data collection method to decide whether independence is a reasonable assumption. The AP syllabus highlights two key ideas:
Random process
Data should come from random sampling (from a defined population) or a randomized experiment (participants randomly assigned to treatment conditions).
Randomization helps break systematic links between observations, making independence plausible.
10% condition for sampling without replacement
When you sample without replacement from a finite population, selecting one individual slightly changes the population for the next selection, creating some dependence.
To keep this dependence small, require the sample size to be no more than 10% of the population size.
In words, the condition is: “The sample size is at most 10% of the population size,” which makes the dependence negligible for inference.
In AP Statistics, you justify the independence condition by clearly describing the random process and stating whether the 10% guideline is met when sampling without replacement. This written justification is an essential part of a complete inference solution.
Normality Condition: Expected Counts Under the Null
The normality condition addresses the shape of the sampling distribution of the sample proportion. For a one-sample z-test for a proportion, we rely on the sampling distribution of being approximately normal if the null hypothesis is true. The syllabus states that the expected number of successes and failures under the null must both be at least 10.
To formalize this requirement, we work with expected counts under the null hypothesis value .
EQUATION
= sample size (number of observations)
= hypothesized population proportion in the null hypothesis
For the normality condition, you check both of the following using the null value (not the sample proportion ):
Expected successes:
Expected failures:
When both inequalities are satisfied, the Central Limit Theorem and binomial approximation results suggest that the distribution of under the null is close enough to normal for the z-test to be reliable.
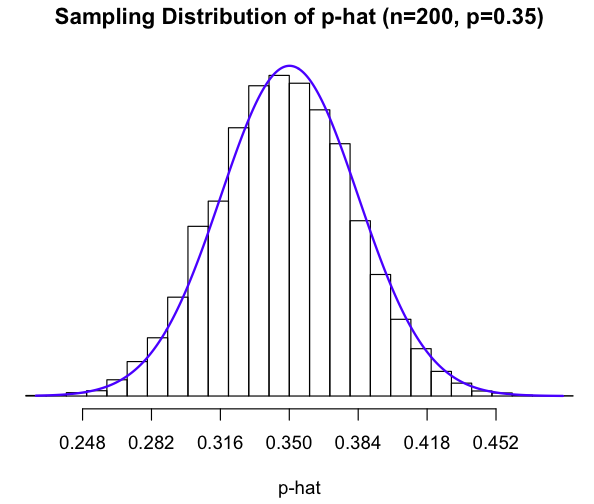
This figure displays three histograms of the sampling distribution of for the same population proportion but sample sizes n=100, n=300, and n=1000, each with an overlaid normal curve. As the sample size grows, the distributions become more bell-shaped and less spread out, mirroring the effect of meeting the conditions and . The specific values shown are illustrative and extend slightly beyond syllabus requirements, but they clearly demonstrate how increased sample size improves the normal approximation. Source.
If one or both conditions fail, the sampling distribution may be significantly skewed or discrete, making the usual z-test and its p-value less trustworthy.
Connecting Conditions to the One-Sample z-Test for a Proportion
The conditions you verify directly support the assumptions behind the z-test statistic and its null distribution:
The independence condition justifies treating the sample proportion as having a stable, predictable variability. When observations are independent, the variance of is well approximated by , which underlies the standard error used in the test statistic.
The normality condition justifies modeling the distribution of (or the corresponding z-statistic) by a standard normal distribution when the null hypothesis is true. This is what allows you to translate the z-statistic into a p-value using the normal curve.
Because of this, verifying conditions is not a formality. It is the logical bridge between the real-world sampling process and the mathematical model used for inference.
How to Write Condition Checks in AP Responses
In AP-level work, you should clearly and concisely state your condition checks before computing the test statistic or p-value. A typical structure includes:
Naming each condition and explicitly indicating whether it is met.
Referencing the context of the problem when discussing the random process and population.
Using the null hypothesis value when calculating expected successes and failures.
A well-written verification might include bullet points such as:
Independence
The data come from a random sample (or randomized experiment) described in the problem.
The sample size is less than 10% of the population, so sampling without replacement does not seriously violate independence.
Normality
Under , both and are at least 10, so the sampling distribution of is approximately normal.
By systematically verifying these conditions, you ensure that any z-test for a population proportion you perform is supported by the AP syllabus requirements for valid statistical inference.
FAQ
The 10% threshold is a practical rule of thumb ensuring that dependence created by sampling without replacement remains negligible. When the sample is no more than 10% of the population, the change in population composition after each selection is too small to meaningfully affect probabilities.
This makes the binomial model — which assumes independent trials — sufficiently accurate for inference.
You should rely on contextual clues. If the problem states the sample was “selected” or “chosen” but does not specify randomisation, you should avoid assuming randomness.
A cautious justification might state:
• If random sampling occurred, independence is plausible.
• If not, independence cannot be confirmed, and the validity of the z-test may be questionable.
The test assesses the plausibility of the null model. Because the sampling distribution used in the z-test is constructed assuming the null hypothesis is true, expected counts must reflect the null proportion.
Using the sample proportion instead would evaluate normality under an assumption the test is trying to challenge.
A normal approximation may still be reasonable, but the inference becomes less reliable. Examiners may still allow use of the z-test if the shortfall is minor and justified.
However, the recommended approach is to:
• Acknowledge the condition is not fully met.
• Proceed cautiously or suggest that an alternative method may be more appropriate in practice.
No — a large sample size does not automatically satisfy the condition. What matters is the combination of sample size and the null proportion.
For rare proportions close to 0 or 1, even very large samples may fail to produce at least 10 expected successes and 10 expected failures.
Practice Questions
Question 1 (1–3 marks)
A researcher plans to conduct a one-sample z-test for a population proportion. The null hypothesis specifies that the true proportion is p0 = 0.40. The researcher selects a random sample of 120 individuals from a population of over 10,000.
(a) State whether the independence condition is satisfied and justify your answer.
(b) Determine whether the normality condition is satisfied for this test.
Mark scheme:
(a) 1 mark: States that independence is satisfied because the sample is randomly selected.
(a) 1 mark: States that the 10% condition is satisfied because 120 is less than 10% of 10,000.
(b) 1 mark: Correctly checks expected successes (120 x 0.40 = 48) and failures (120 x 0.60 = 72), both at least 10, concluding that the normality condition is satisfied.
Question 2 (4–6 marks)
A school administrator wishes to test whether the proportion of students who prefer remote learning differs from the previously reported value of 0.55. They randomly sample 150 students from a school of 2,000.
(a) Explain whether the independence condition is met in this context.
(b) Verify the normality condition required for using a one-sample z-test for a population proportion.
(c) Briefly explain why verifying both conditions is essential before proceeding with the test.
Mark scheme:
(a) 1 mark: States that the sample is randomly selected, supporting independence.
(a) 1 mark: Notes that the sample size (150) is less than 10% of the population (2,000), satisfying the 10% condition.
(b) 1 mark: Correctly calculates expected successes (150 x 0.55 = 82.5).
(b) 1 mark: Correctly calculates expected failures (150 x 0.45 = 67.5).
(b) 1 mark: Concludes that both expected counts exceed 10, so the normality condition is satisfied.
(c) 1 mark: Explains that both conditions are required to justify using the normal approximation and ensure valid inference from the z-test.
