
AP Syllabus focus:
‘Null hypothesis (H0): Specifies the population proportion under the assumption of no effect or difference (p = p0). - Alternative hypothesis (Ha): Indicates the direction or nature of the effect or difference being tested against the null hypothesis, formulated based on the research question (e.g., p < p0, p > p0, or p ≠ p0).’
Identifying the null and alternative hypotheses is the essential first step in any significance test for a population proportion, guiding the logic, structure, and direction of the statistical investigation.
Understanding the Role of Statistical Hypotheses
Statistical hypotheses provide a formal framework for evaluating claims about a population proportion. They define what is initially assumed to be true (null hypothesis) and what competing claim will be evaluated using sample evidence (alternative hypothesis). Establishing these statements clearly is crucial because every subsequent inference—conditions checking, test statistic calculation, and p-value interpretation—depends on the hypotheses being correctly formulated.
The Null Hypothesis (H0)
The null hypothesis is a statement about the population proportion that reflects no effect, no difference, or a status quo value. It is always written as an equality because it specifies the exact proportion assumed to be true for the purposes of the test.
Null Hypothesis (H0): The hypothesis stating that the population proportion equals a specific claimed value ().
The null hypothesis anchors the test by providing the value used to compute expected outcomes under the assumption that this claim is correct.
The Alternative Hypothesis (Ha)
The alternative hypothesis expresses the research question’s claim. It identifies the type of difference the researcher is looking for and always uses a strict inequality. The choice of inequality depends entirely on the context of the investigative question.
Alternative Hypothesis (Ha): The hypothesis indicating the direction or existence of a difference in the population proportion, using , , or .
Because the alternative defines the direction of evidence, it determines whether the test is one-sided or two-sided, which in turn affects the p-value calculation.
A one-sided alternative is appropriate when the research question focuses on determining whether the proportion is specifically greater than or specifically less than the hypothesized value. A two-sided alternative is used when any difference from the hypothesized value is of interest, regardless of direction.
For a two-sided alternative, Ha:p≠p0H_a: p \neq p_0Ha:p=p0, we are interested in deviations from p0p_0p0 in either direction.
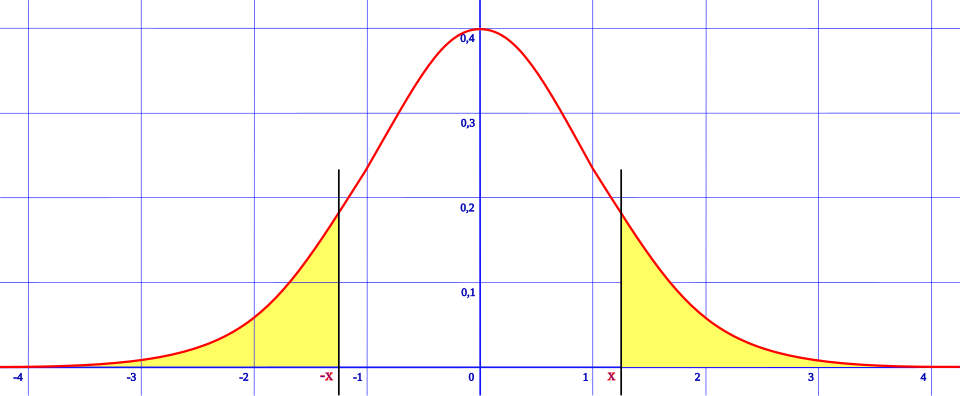
This figure shows a standard normal curve with both tails shaded to represent the rejection regions of a two-tailed test. Any test statistic falling in either shaded tail would lead to rejection of the null hypothesis in favor of a two-sided alternative. The axes and gridlines provide additional scale information that extends slightly beyond syllabus requirements but deepens conceptual understanding. Source.
Structuring Hypotheses in Statistical Inference
Clear formulation of hypotheses ensures that the statistical test addresses the exact question under investigation. The hypotheses guide interpretation, defining what kind of evidence would contradict the null hypothesis.
Features of the Null Hypothesis
The null hypothesis always includes:
A specific population proportion () given by prior knowledge, a claim, or historical data.
An equality statement, reflecting that the test assumes this value is true until the data suggest otherwise.
The null is never written with an inequality, because the test requires a specific value to generate the sampling distribution used for inference.
Features of the Alternative Hypothesis
The alternative hypothesis reflects the research goal. Its strict inequality symbol communicates the nature of evidence being sought.
Common forms include:
when investigating whether the true proportion is smaller than the hypothesized value.
when seeking evidence the true proportion exceeds the hypothesized value.
when any deviation—higher or lower—is relevant.
Each inequality changes the tail or tails of the distribution used to calculate the p-value, directly affecting the strength and interpretation of statistical evidence.
For a one-sided alternative, such as Ha:p>p0H_a: p > p_0Ha:p>p0, only unusually large values of the sample proportion count as evidence against H0H_0H0; unusually small values do not.
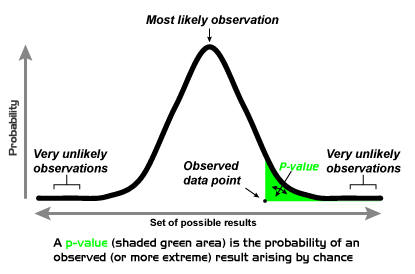
This graph displays a normal curve with a single shaded tail representing the p-value for a one-sided test. Values in the shaded region are unlikely under the null hypothesis and supply evidence for a directional alternative. The inclusion of the p-value label extends slightly beyond the scope of hypothesis formulation but meaningfully connects hypotheses to later inferential steps. Source.
Connecting Hypotheses to the Research Question
Interpreting context correctly is essential for selecting the appropriate form of Ha. The hypotheses must align with:
The wording of the claim, such as “greater than,” “less than,” or “different from.”
The practical consequences of detecting a difference in a particular direction.
The purpose of the investigation, whether confirmatory or exploratory.
Identifying the hypotheses is more than a symbolic exercise; it establishes the logical structure for the entire inference process. Writers of AP Statistics responses must show not only correct hypotheses but also that they understand why each was chosen.
Relationship Between Hypotheses and the Testing Procedure
Once the null and alternative hypotheses are identified, the remainder of the significance test flows from them. Specifically:
The null hypothesis provides the value () used in the standard error and test statistic calculations.
The alternative hypothesis determines whether the p-value is computed from one tail or two tails of the standard normal distribution.
The combination of hypotheses shapes the interpretation of results, as conclusions must relate directly back to these statements.
EQUATION
= Sample proportion
= Proportion assumed under H0
= Sample size
Formulating hypotheses appropriately ensures that this calculation evaluates the correct question and that any resulting decision is meaningful in the study’s context.
A well-constructed set of hypotheses thus provides the essential foundation for correctly performing, interpreting, and communicating a significance test for a population proportion.
FAQ
Look for directional wording. If the question includes terms such as higher, lower, increase, decrease, or less than, it typically implies a one-sided alternative.
If the question uses broader language such as different, changed, or not the same, a two-sided alternative is usually appropriate.
When wording is ambiguous, consider the practical purpose of the investigation and what outcomes would meaningfully challenge the null assumption.
A significance test requires a single specific value to model the sampling distribution of the sample proportion. The equality in the null hypothesis provides that fixed value.
Without a defined value, neither the test statistic nor the p-value could be computed, as both rely on the assumption that the null represents the true population proportion.
Students often mistakenly:
• Use a non-strict inequality (for example, p >= p0).
• Choose a direction that contradicts the context.
• Match the direction to an expected outcome rather than the stated research question.
The direction must reflect what the investigator aims to detect, not the result they anticipate getting.
Surprising outcomes focus attention on the regions of the sampling distribution that contradict the null hypothesis.
• In a one-sided test, only extreme results in the specified direction matter.
• In a two-sided test, extreme results in either direction count as evidence.
This choice influences both the strength and location of evidence used in the test.
No. Hypotheses must be established before examining the data to ensure the validity of the test.
Changing hypotheses afterwards introduces bias, as it tailors the claim to match the observed outcome.
If researchers wish to explore unexpected patterns observed in data, they may conduct a separate exploratory analysis, but this should not be considered a confirmatory test of the original claim.
Practice Questions
Question 1 (1–3 marks)
A researcher believes that the proportion of customers who prefer a new product is different from 0.40. They collect a random sample to investigate this claim.
(a) State the null hypothesis for this investigation.
(b) State an appropriate alternative hypothesis.
Question 1
(a) 1 mark: Correctly states the null hypothesis as H0: p = 0.40.
(b) 1–2 marks:
• 1 mark for stating a two-sided alternative hypothesis: Ha: p ≠ 0.40.
• Full 2 marks only if the answer clearly indicates that the researcher is testing for any difference, not specifically greater or less.
Question 2 (4–6 marks)
A charity claims that at least 55% of adults in a city have donated to them in the past year. A student wishes to test this claim using a random sample.
(a) Formulate the null and alternative hypotheses the student should use.
(b) Explain why the direction of the alternative hypothesis is important for interpreting the results.
(c) Briefly describe how the hypotheses determine the part(s) of the sampling distribution used to assess the evidence.
Question 2
(a) 1–2 marks:
• 1 mark for correctly writing H0: p = 0.55.
• 1 mark for correctly writing Ha as p < 0.55 (because the claim is "at least 55%", so the student tests for evidence that the true proportion is lower).
(b) 1–2 marks:
• 1 mark for stating that the alternative hypothesis determines whether the test is one-sided or two-sided.
• 1 mark for explaining that this affects the direction in which evidence against the null hypothesis is sought.
(c) 2 marks:
• 1 mark for noting that the null hypothesis specifies the sampling distribution used for comparison.
• 1 mark for explaining that the alternative hypothesis identifies whether evidence is taken from one tail (lower tail here) or both tails of the distribution.
