
AP Syllabus focus:
‘Identify scenarios where inference about proportions or means is required, differentiating between the use of z-tests for proportions (when population standard deviation is known) and t-tests for means (when it’s unknown). Recognize when to apply one-sample, two-sample, and paired t-tests based on the study design and data structure. Decision criteria for choosing the correct inference test based on sample size, population standard deviation knowledge, and sample independence.’
Selecting the right inference procedure requires matching the study design, parameter of interest, and available information with the correct statistical method. Clear differentiation among tests helps ensure valid conclusions.
Understanding the Purpose of Selecting Inference Procedures
Correctly choosing an inference procedure ensures that statistical conclusions accurately reflect the population process being studied. This selection depends on identifying whether the parameter of interest is a population proportion or population mean, whether samples are independent or paired, and whether the population standard deviation is known.
Distinguishing Between Proportions and Means
Different inference procedures apply depending on the type of variable being measured.
Identifying Proportion Scenarios
Inference about a population proportion applies when the variable is categorical, and the research question concerns the proportion of individuals with a certain attribute. In such cases, inference uses z-procedures, since the sampling distribution of a sample proportion becomes approximately normal under suitable conditions.
Population proportion: The long-run proportion of individuals in a population possessing a specified categorical characteristic.
Because proportion problems do not involve unknown population standard deviations in the same way mean problems do, z-tests and z-intervals remain the appropriate procedures when conditions are satisfied.
Identifying Mean Scenarios
Inference about a population mean applies when the variable is quantitative and the parameter of interest describes the central tendency of numerical values. When the population standard deviation is unknown, which is nearly always the case in practice, students must use t-procedures.
Population mean: The average value of a quantitative variable for all individuals in a population.
The choice of a t-procedure rather than a z-procedure reflects the extra uncertainty introduced by estimating variability from the sample.
Differentiating Among One-Sample, Two-Sample, and Paired Designs
Correctly identifying the study design is essential when selecting among t-procedures.
One-Sample Situations
A one-sample t-test or t-interval is appropriate when a single random sample is used to estimate or test a population mean. Only one group of measurements is collected, and the goal is to make an inference about one population.
Two Independent Samples
A two-sample t-test or two-sample t-interval applies when two independent groups are compared. Independence means that observations in one sample do not influence or pair with observations in the other sample.
Independent samples: Two samples in which the individuals in one group provide no information about individuals in the other group.
This structure supports inference about the difference between two population means.
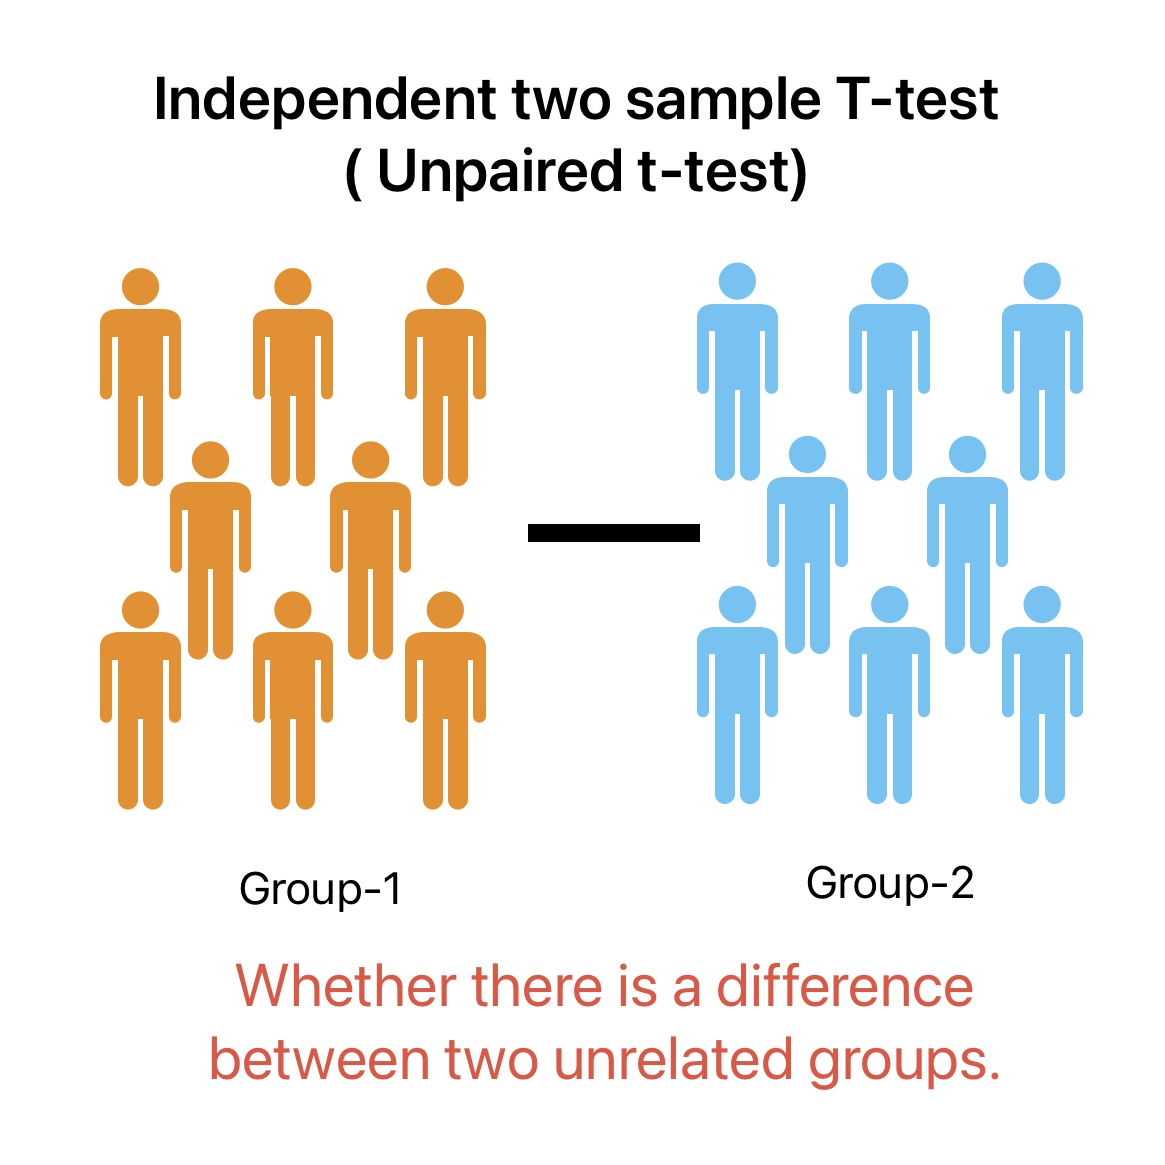
This illustration shows an independent two-sample t-test, where two unrelated groups are compared on a quantitative variable, each representing a distinct population. It emphasizes that the procedure evaluates whether the group means differ. Extra contextual labels appear in the original diagram but do not extend beyond the concepts addressed in the study notes. Source.
Paired (Matched) Designs
Sometimes two measurements are linked for each subject, such as before-and-after scores or matched individuals. These designs require a paired t-test, which treats each pair’s difference as a single quantitative value.
Paired data: Observations that are meaningfully linked, where differences within each pair represent the values analyzed.
Because analysis reduces the data to differences, the inference becomes a one-sample t-procedure on those differences rather than a two-sample method.
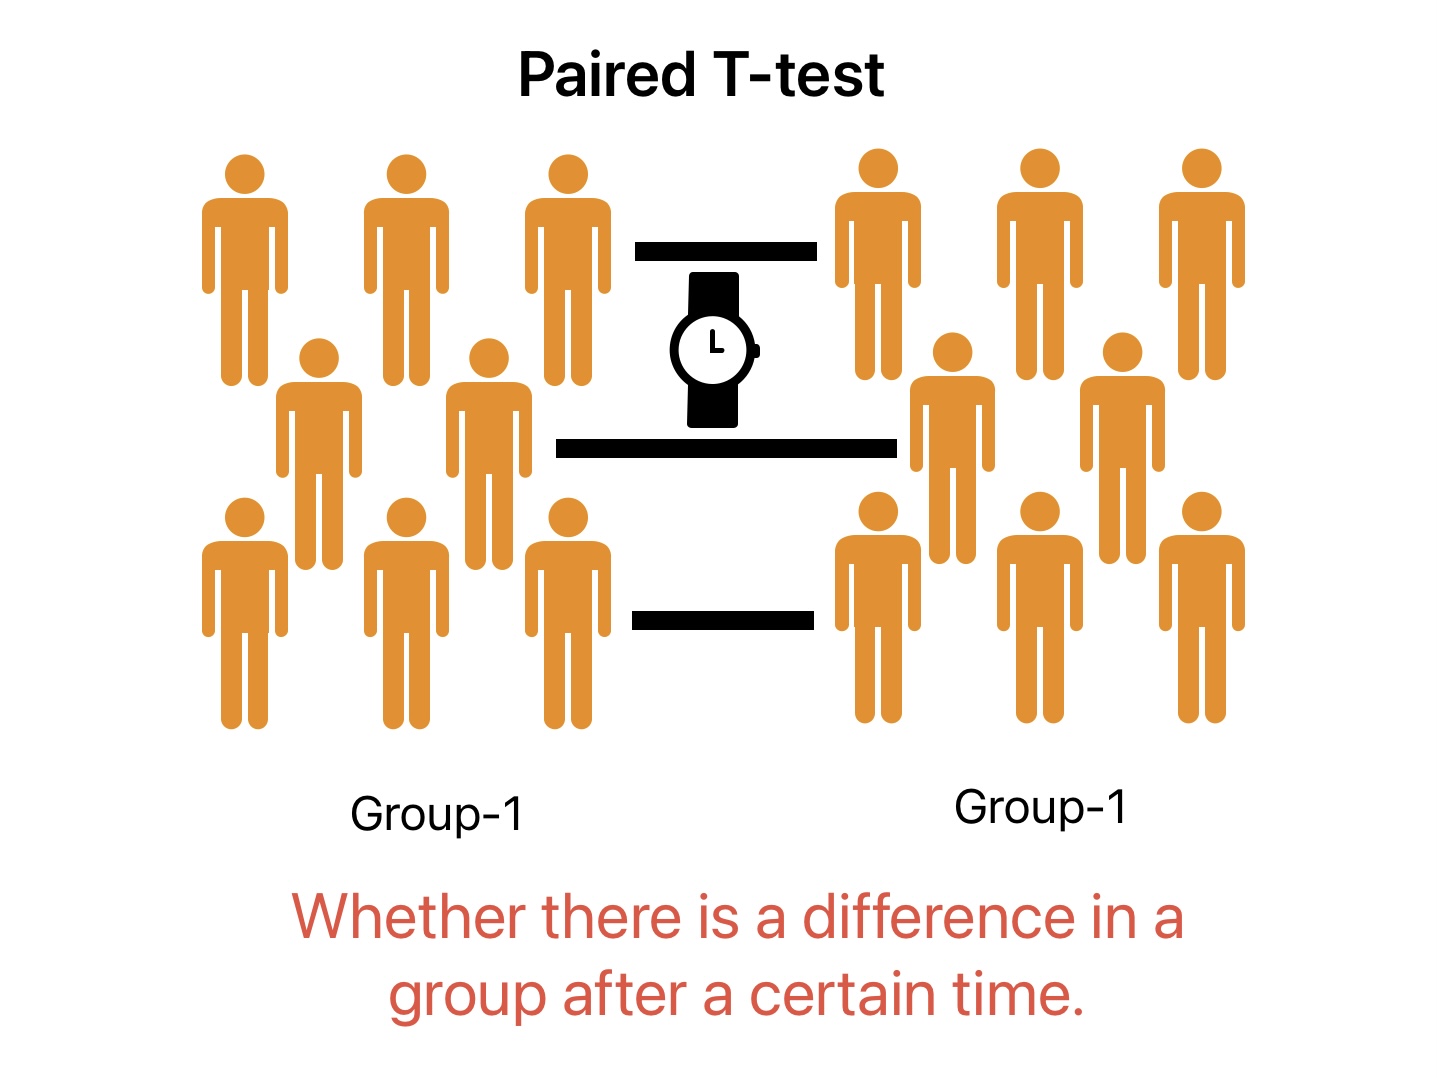
This diagram represents a paired t-test in which the same group is measured twice, highlighting the linked structure of repeated observations. It conveys the pairing essential for analyzing differences rather than separate group means. The image includes a small time icon not required by the syllabus but does not add extraneous statistical content. Source.
Considering Population Standard Deviation and Its Role
The population standard deviation, σ, determines whether a z-procedure is theoretically valid. However, in real studies σ is rarely known. For proportions it is unnecessary, but for means, its absence requires using t-distributions, which incorporate sample variability through the sample standard deviation s.
EQUATION
= Sample standard deviation
= Sample size
This expression shows why uncertainty increases when using s instead of σ, justifying reliance on t-distributions.
A normal sentence is placed here to follow the required spacing rules before another equation.
EQUATION
= Sample mean
= Hypothesized population mean
The t-statistic reflects how far the sample mean lies from the hypothesized mean in standardized units.
Ensuring Sample Independence Before Selecting a Procedure
Every inference method depends on independent observations, either through proper random sampling or random assignment. When sampling without replacement, the sample size should be no more than 10% of the population to maintain approximate independence.
Independence also determines whether a two-sample or paired design is valid; failing to classify sample structure correctly results in choosing the wrong test.
Decision Criteria for Selecting the Correct Test
Students should consider the following guiding questions:
Step 1: Identify the Parameter of Interest
• Is the parameter a proportion?
• Is the parameter a mean?
Step 2: Determine What Is Known About Variability
• Is the population standard deviation known (rare for means)?
• If unknown, use t-procedures for means.
Step 3: Recognize the Study Design
• One-sample: One group, one parameter.
• Two-sample: Two independent groups.
• Paired: Linked or matched observations.
Step 4: Check Independence and Sampling Structure
• Was data collected randomly?
• Are samples independent?
• If paired, are differences meaningful and consistent with study design?
These criteria ensure students accurately identify whether the appropriate inference procedure is a z-test for proportions, a one-sample t-test, a two-sample t-test, or a paired t-test, fully aligned with AP expectations.
FAQ
Check the underlying measurement scale: if each observation places an individual into a category, it is a proportion problem. If it records a numerical measurement, it is a mean problem.
Some variables appear numerical but are still categorical (for example, coded responses such as 1 = yes, 2 = no).
If a number only labels a group and does not reflect magnitude, treat it as categorical and use a proportion-based procedure.
Many students assume that the presence of two sets of numbers automatically means two samples. Instead, the key question is whether each value in one set corresponds meaningfully to a value in the other.
If the pairing reflects natural or designed links — identical individuals tested twice, matched pairs, or repeated trials — treat the data as paired and use a paired t-test.
With small samples, focus on whether the data (or differences, if paired) come from a distribution that is approximately symmetric and free of strong outliers.
If no plot is available, consider whether the measurement process would realistically yield extreme skew.
When strong skewness is plausible, a larger sample is advisable before applying t-procedures.
Only in rare educational or theoretical contexts where the population standard deviation is explicitly provided by the problem setter.
In real-world data analysis, the population standard deviation is virtually never known.
Because of this, t-tests are overwhelmingly preferred for inference about means.
A one-sample procedure is appropriate when the research question concerns a single population mean or proportion and the data come from a single random sample.
Key indicators include:
• Only one group is observed.
• There is no comparison group.
• The goal is to estimate or test a single parameter rather than a difference between parameters.
Practice Questions
Question 1 (1–3 marks)
A researcher records whether individuals in a sample support a new policy (support vs do not support). The researcher wants to estimate the proportion of supporters in the population.
(a) Identify the appropriate type of inference procedure.
(b) State the key condition that must be checked before using this procedure.
Question 1
(a)
• Identifies a one-sample z-procedure for a population proportion (1 mark)
(b)
• States that the data must come from a random sample or represent independent observations (1 mark)
OR
• States that the sample size must be large enough so that both expected successes and failures are at least 10 (1 mark)
(Max 2 marks for part (b); total question max 3 marks)
Question 2 (4–6 marks)
A sports scientist measures the reaction time (in milliseconds) of athletes before and after a specialised training programme. Each athlete completes both tests.
(a) Explain which inference procedure is appropriate for analysing these data and justify your choice based on the study design.
(b) Describe the parameter being estimated or tested.
(c) State two conditions that should be checked before carrying out the selected inference procedure.
(d) Briefly explain why a two-sample t-test would not be suitable in this context.
Question 2
(a)
• Identifies the paired t-test as the appropriate procedure (1 mark)
• Justifies by explaining that each individual provides two related measurements or that differences are analysed (1 mark)
(b)
• Correctly describes the parameter as the mean difference in reaction time for the population of athletes (1 mark)
(c)
Any two of the following (1 mark each, max 2 marks):
• Differences come from a random sample of athletes or are independent.
• The distribution of differences is approximately normal or not strongly skewed/outlier-heavy.
• The measurements are meaningfully paired.
(d)
• Explains that a two-sample t-test requires independent samples, whereas these observations are paired/repeated measures (1 mark)
