
AP Syllabus focus:
‘Step-by-step process of conducting an inference test, including checking conditions (normality, independence, and random sampling), calculating test statistics, and finding p-values or confidence intervals.
- Understanding and application of technology or tables to find critical values and p-values.
- Calculation of degrees of freedom, especially for two-sample t-tests where software or technology is used to estimate.’
Efficiently implementing inference procedures requires following a structured process that ensures valid conclusions. These notes outline the essential steps, conditions, and reasoning used when performing statistical inference.
Conducting an Inference Test: The Step-by-Step Structure
Implementing an inference procedure in AP Statistics follows a consistent framework that emphasizes proper data collection, verification of assumptions, numerical computation, and statistical reasoning. This structure supports both significance tests and confidence intervals, which are the two major tools of inferential analysis.
Step 1: Identify the Inference Procedure
Before performing any calculations, determine whether the situation requires an inference procedure for a mean, difference of means, proportion, or difference of proportions. For this subsubtopic, focus remains on procedures involving means, which use t-distributions because the population standard deviation is typically unknown.
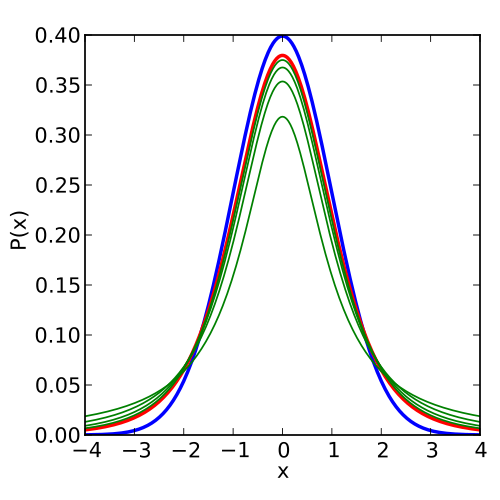
Student’s t-distribution with 5 degrees of freedom, illustrating the reference distribution used for calculating t-statistics, p-values, and critical values in inference procedures. Source.
Step 2: Check Conditions for Validity
Inference procedures depend on assumptions that help justify the use of the sampling distribution model. Students must verify these conditions using sample information and study design.
Key conditions include:
Random sampling or random assignment
Ensures observations are representative and independent.Independence of observations
If sampling without replacement, the sample size should be no more than 10% of the population. This supports modeling the sampling distribution accurately.Normality of the sampling distribution
Required because the t-distribution approximates normality as sample size grows.
• For small samples (), data should show no strong skewness or outliers.
• For larger samples, the Central Limit Theorem supports normality.
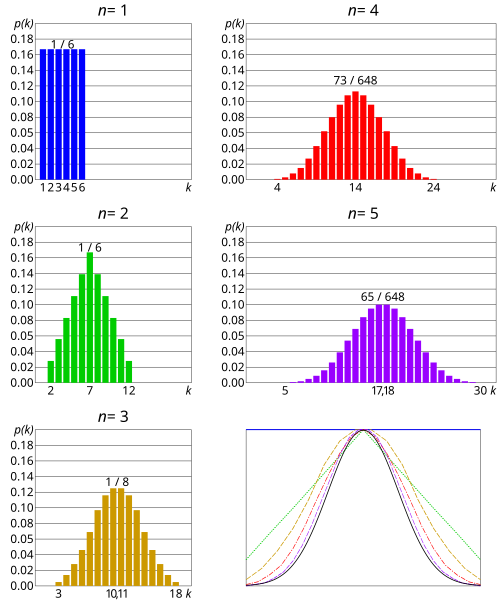
These distributions of sums of fair dice visually demonstrate the Central Limit Theorem: as sample size increases, the sampling distribution becomes more bell-shaped and approximately normal. Source.
Central Limit Theorem: When sample size is sufficiently large, the sampling distribution of the sample mean becomes approximately normal, regardless of population shape.
These checks help ensure that inference results are reliable and interpretable within the context of the study.
Step 3: Calculate the Test Statistic or Construct the Interval
Once conditions are met, proceed with computation. For significance tests involving means, calculate a t-statistic, which measures how far the sample mean is from the null hypothesis value in standard error units.
EQUATION
= Sample mean
= Hypothesized population mean
= Sample standard deviation
= Sample size
After computing the test statistic, one may also compute or interpret a confidence interval, which provides a range of plausible values for the population mean.
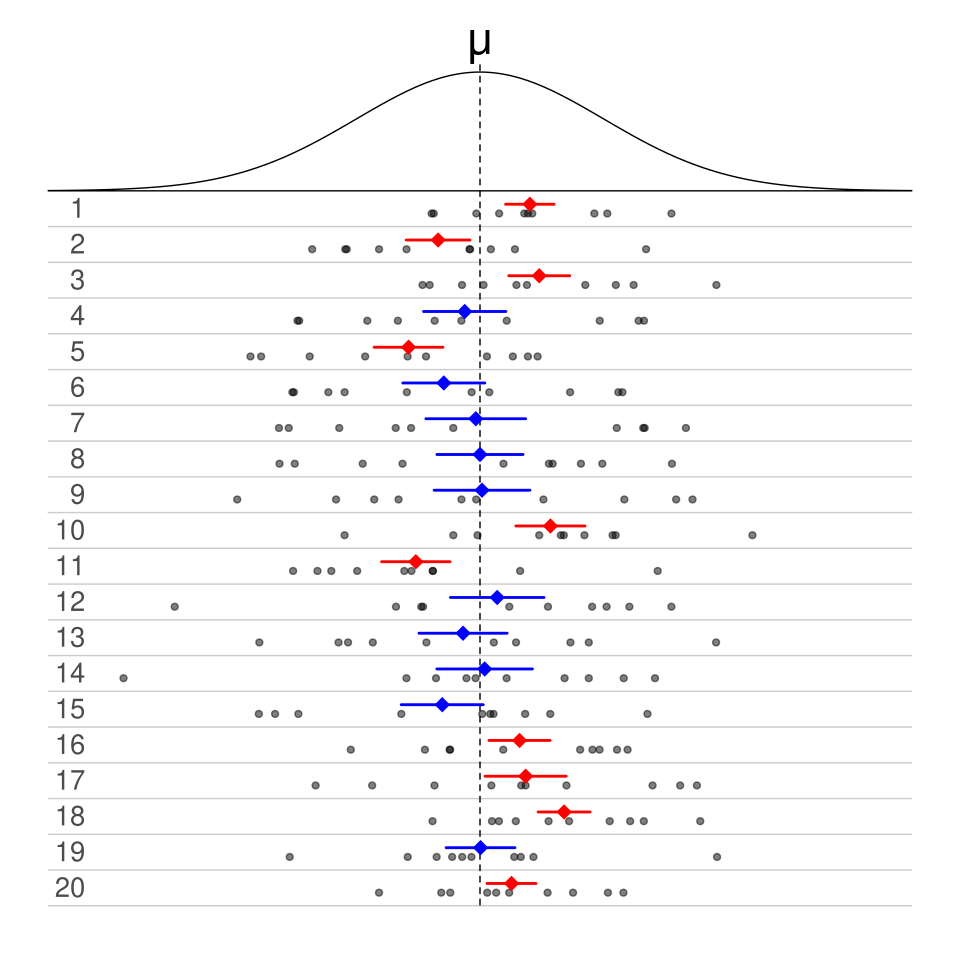
Each horizontal segment represents a confidence interval from a different random sample; blue intervals contain the true mean while red intervals do not, illustrating the repeated-sampling interpretation of confidence intervals. Source.
Step 4: Determine the p-Value or Critical Values
The p-value measures the probability of observing a test statistic as extreme as the computed value, assuming the null hypothesis is true. Technology or a t-distribution table is used to find this probability.
p-value: The probability of obtaining a statistic as extreme as the observed one under the assumption that the null hypothesis is true.
Students should recognize that software often provides more precise p-values than printed tables, especially when degrees of freedom are non-integer or large.
When constructing a confidence interval, determine the appropriate critical value using the desired confidence level and the degrees of freedom.
Step 5: Determine Degrees of Freedom
Degrees of freedom (df) depend on the specific inference procedure. For single-sample t-procedures,
df = n − 1, directly relating to sample size.
Two-sample procedures require estimated degrees of freedom that depend on variability and sample sizes. Statistical software is preferred because the formula is complex, and using technology ensures accuracy in determining p-values and critical values.
Step 6: State and Justify the Conclusion
The conclusion interprets results within the context of the research question. Important elements include:
Compare the p-value with the significance level ().
Reject or fail to reject the null hypothesis based on this comparison.
Refer explicitly to population parameters, not sample statistics.
Avoid causal claims unless random assignment was used.
Using Technology for Inference
Technology plays a central role in implementing inference procedures accurately and efficiently. Software and calculators can:
Compute test statistics
Provide exact p-values
Determine critical values
Estimate degrees of freedom for two-sample tests
Generate confidence intervals directly
Students must understand the underlying concepts even when using technology, as interpretation—not button sequences—is the focus of AP Statistics.
Summary of Procedural Flow
Identify the correct inference procedure.
Check conditions: randomization, independence, normality.
Compute test statistics or interval components.
Use technology or tables for p-values and critical values.
Evaluate results and communicate a context-driven conclusion.
FAQ
The significance level affects how extreme the test statistic must be for the null hypothesis to be rejected. A smaller significance level requires stronger evidence before rejecting the null hypothesis.
It also influences critical values: lower alpha levels lead to larger critical values, which makes rejecting the null hypothesis less likely.
Researchers typically choose alpha before collecting data to avoid biased decision-making.
A frequent error is assuming any small sample violates normality. In reality, minor skewness or slight irregularities usually do not invalidate a t-test.
Students may also misinterpret graphical displays. For example, a moderate cluster of points away from the centre may seem concerning, but only strong skew or clear outliers should raise doubts.
Finally, some learners overlook the idea that larger samples reduce the importance of perfect normality.
Rounding differences and the methods used to approximate the tail areas of the t-distribution can lead to small discrepancies.
Some calculators use simplified algorithms, while statistical software may use high-precision numerical integration.
Despite minor differences, all appropriately calculated p-values lead to the same practical conclusion in AP Statistics.
The direction determines whether the p-value is calculated using one tail or two tails of the distribution.
Choosing the direction after examining the data introduces bias because the test becomes dependent on observed outcomes.
Pre-specifying prevents inflating Type I error rates and maintains the validity of the inference procedure.
Stability can be affected by measurement imprecision, inconsistent data collection procedures, or external influences affecting the variable being measured.
Other influences include:
• Sampling from a population with high natural variability
• Small sample sizes that amplify the effect of unusual observations
• Violations of independence due to clustering or repeated measurements
Addressing these issues improves the reliability of inference results.
Practice Questions
Question 1 (1–3 marks)
A researcher collects a random sample of 20 observations to test a claim about a population mean. Before carrying out the t-test, the researcher sketches a dotplot of the data and observes no strong skewness or outliers.
(a) State whether the conditions for using a one-sample t-test are satisfied and justify your answer.
Question 1 (1–3 marks)
• 1 mark for stating that the conditions for the one-sample t-test are satisfied.
• 1 mark for referencing random sampling or independence.
• 1 mark for noting that the sample size is below 30 but the distribution shows no strong skewness or outliers, supporting the normality condition.
Question 2 (4–6 marks)
A wildlife biologist wishes to determine whether the mean body mass of a particular bird species has changed from the historical value of 14.2 grams. A random sample of 36 birds is taken from the current population. The sample mean is 13.7 grams, and the sample standard deviation is 2.1 grams.
(a) Identify the appropriate inference procedure and explain why it is suitable.
(b) State the hypotheses for the significance test.
(c) Describe the steps the biologist would take to calculate the test statistic and the p-value. You do not need to perform the calculations.
(d) Explain how the conclusion should be communicated in context.
Question 2 (4–6 marks)
(a)
• 1 mark for identifying the one-sample t-test for a mean.
• 1 mark for explaining that the population standard deviation is unknown and the data come from a random sample.
(b)
• 1 mark for correctly stating H0: mean = 14.2 grams.
• 1 mark for correctly stating Ha: mean differs from 14.2 grams (two-sided).
(c)
• 1 mark for describing that the test statistic is computed using the sample mean, hypothesised mean, sample standard deviation, and sample size.
• 1 mark for stating that the p-value is obtained using the t-distribution with appropriate degrees of freedom.
(d)
• 1 mark for explaining that the decision is based on comparing the p-value with the significance level.
• 1 mark for clearly stating that the conclusion must refer to the population mean of the bird species and be written in context.
