
AP Syllabus focus:
‘How to effectively communicate the results of an inference test, including the interpretation of p-values and confidence intervals in the context of the research question. Distinguishing between statistical significance and practical significance when discussing results. Best practices for reporting findings in a manner that is accessible to a general audience, including the use of non-technical language and emphasis on the implications of the statistical analysis. Addressing limitations of the inference process and potential next steps.’
Communicating results in inference requires clarity, context, and precision so audiences understand what the statistical evidence suggests and why it matters for the research question.
Presenting Inference Results Clearly
Effective communication of inference outcomes involves linking statistical findings directly to the research question, maintaining accessible language, and describing what the results imply about the population. Students must emphasize how conclusions follow from the computed p-value or confidence interval, rather than from intuition alone.
Reporting p-Values in Context
A p-value is the probability of obtaining a sample result as extreme as or more extreme than the observed statistic, assuming the null hypothesis is true. Its interpretation must connect to the study’s purpose.
P-value: The probability of observing results at least as extreme as the sample data if the null hypothesis is true.
After stating this value, results should be tied to the significance level α and the real-world meaning of the comparison.
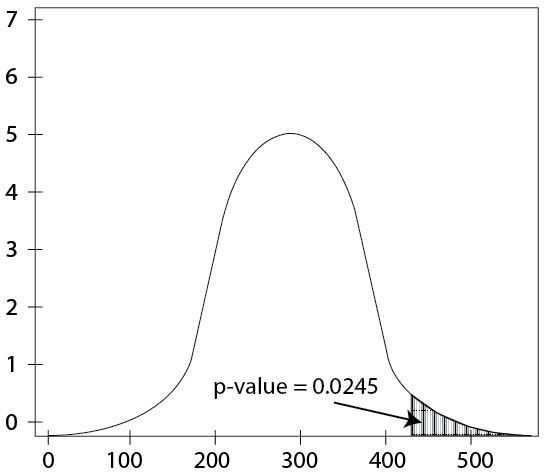
The shaded area under the curve represents the probability of observing a test statistic at least as extreme as the sample result, assuming the null hypothesis is true. The graphic visualizes how p-values correspond to tail areas. The image includes some additional contextual elements not required by the syllabus. Source.
Communication should avoid implying certainty; instead, note that evidence is “consistent with” or “provides support for” a given claim. When describing statistical significance, students should articulate what the result suggests about the population mean or difference in means, expressed in plain language.
A statistically significant finding must still be conveyed cautiously, explaining the direction of the effect and why the evidence challenges the null hypothesis within the context of the study design.
Communicating Confidence Interval Interpretations
A confidence interval describes a plausible range of values for a population parameter based on the sample. Its interpretation should highlight the long-run behavior of repeated intervals and clarify what the interval suggests about the parameter of interest.
Confidence Interval: An interval estimate constructed so that C% of such intervals produced from repeated sampling would contain the true population parameter.
When reporting an interval, results should be tied directly to the research question and articulated in nontechnical language.
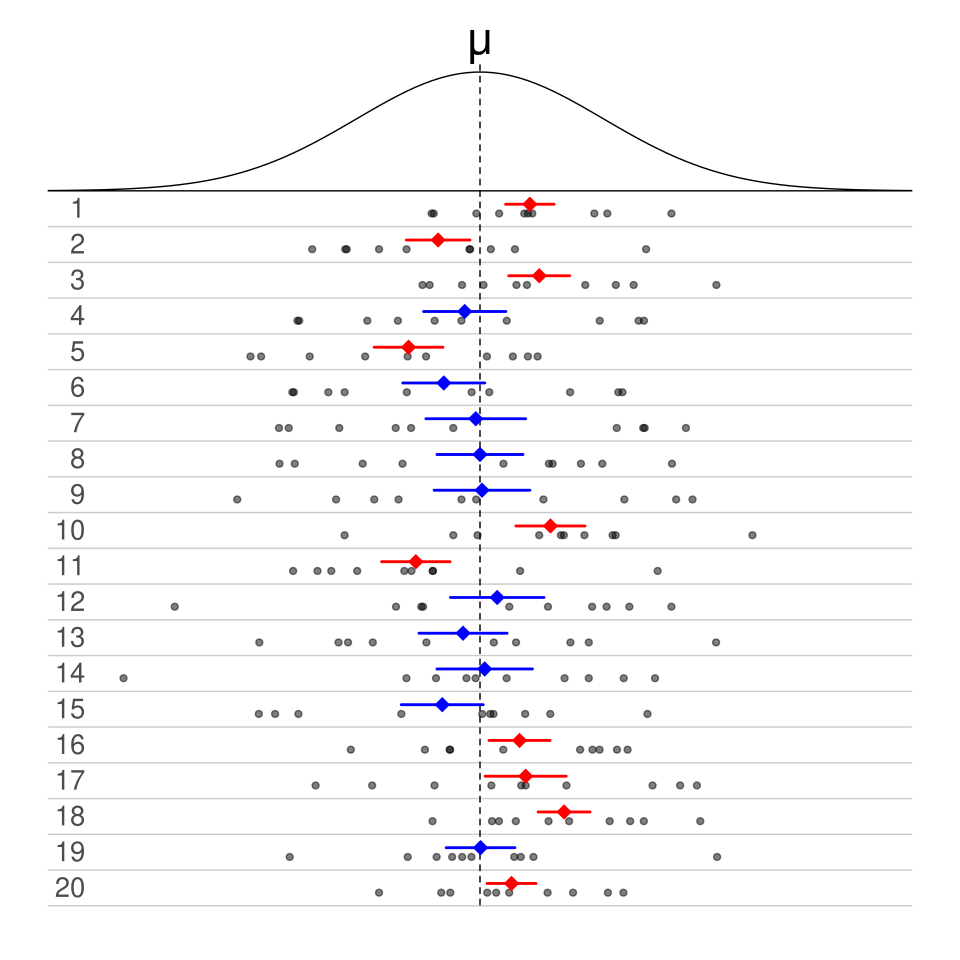
The graphic illustrates how repeated confidence intervals behave across many samples. Some intervals contain the true parameter, while others miss it, reinforcing long-run interpretation. The figure uses 50% intervals, a detail not required by the syllabus but consistent with the concept of coverage probability. Source.
Students should identify whether values of interest—such as no difference or a hypothesized mean—fall inside or outside the interval and what that indicates about the population.
Distinguishing Statistical and Practical Significance
Clear communication requires differentiating statistical significance, determined by p-values and confidence intervals, from practical significance, which considers whether the detected effect matters in a real-world context.
Practical Significance: The extent to which an observed effect is large or meaningful enough to have real-world importance, regardless of statistical significance.
Even when a result meets formal criteria for statistical significance, students should address whether the magnitude of the effect is meaningful. Conversely, nonsignificant results may still prompt discussion if the interval suggests a potentially important effect that lacked precision due to small samples.
A sentence explaining the practical implications should follow any formal decision, reinforcing that statistical tools support, rather than replace, real-world judgment.
Best Practices for Accessible Communication
Clear reporting benefits from structure, precision, and the avoidance of unnecessary jargon. Students should frame conclusions so that a general audience can interpret them accurately.
Strategies for Effective Explanation
Use plain language to translate statistical concepts into real-world meaning.
State the research question before presenting results to maintain focus.
Describe the direction of the effect (greater than, less than, or different).
Report numerical results alongside verbal interpretations to strengthen clarity.
Phrase conclusions using “evidence suggests” rather than making absolute claims.
These practices help ensure that readers understand both the statistical reasoning and the implications of the findings.
Addressing Limitations and Next Steps
Inference results should be communicated with acknowledgment of study limitations, as the syllabus emphasizes transparent reporting. This includes mentioning concerns such as sample size, randomness, measurement error, or assumptions about population distributions.
Students should also note how these limitations might affect the reliability of the inference and propose reasonable next steps, such as collecting more data, redesigning the sampling method, or exploring additional variables.
Recognizing limitations demonstrates an understanding that inference is inherently uncertain and that interpretations rely on conditions and study design. Communicating these constraints helps audiences interpret results responsibly and evaluate the strength of the evidence.
FAQ
Statistical conclusions are always based on sample data, which introduces uncertainty. Because we can never observe every member of a population, inference cannot establish absolute certainty.
Using cautious language helps communicate that results reflect evidence rather than proof. This prevents misinterpretation by non-experts and encourages readers to consider uncertainty, underlying assumptions, and study limitations.
The goal is clarity, not simplification to the point of inaccuracy. A useful guideline is to explain only what is necessary for the audience to understand the conclusion.
Focus on:
• what was compared,
• what the evidence suggests,
• how confident we are, and
• what the result implies in the real world.
Avoid formulas, specialist jargon, or references to statistical tables unless the audience specifically requires them.
Clarity often comes from explicitly separating the two ideas. For example: “The result was statistically significant, meaning the data provide evidence of an effect; however, the size of the effect is small and may not matter in practice.”
This structure prevents readers from assuming that significance automatically implies real-world importance. It also encourages a more thoughtful interpretation of the findings.
Use wording that emphasises plausibility rather than certainty. For example: “Based on our data, the true mean is likely to fall within this range.”
Another helpful approach is to describe what the interval rules out. For example: “These results make very large effects unlikely.”
This shifts the focus from the technical construction of the interval to how it informs understanding of the population.
Avoid implying that a p-value measures the probability the hypothesis is true; it measures the probability of the data under the null model.
Do not describe the confidence interval as containing the true value with C% probability; instead, present it as a range supported by the data.
Also avoid overstating certainty, ignoring study limitations, or failing to distinguish between statistical and practical importance.
Practice Questions
(1–3 marks)
A researcher reports a p-value of 0.03 when testing whether the mean reaction time of students differs from 0.5 seconds. Explain, in context, what this p-value means and how the result should be communicated to a general audience.
(1–3 marks)
1 mark: States that the p-value represents the probability of observing a result as extreme as the sample finding, assuming the null hypothesis is true.
1 mark: Interprets the p-value in the context of mean reaction time (e.g., such data would be unlikely if the true mean were 0.5 seconds).
1 mark: Communicates the conclusion appropriately for a general audience, noting evidence rather than certainty (e.g., “The data provide evidence that the mean reaction time differs from 0.5 seconds”).
(4–6 marks)
A study constructs a 95% confidence interval for the mean reduction in blood pressure after a new treatment. The interval is (1.2 mmHg, 6.8 mmHg).
(a) Explain how this interval should be interpreted in clear, non-technical language.
(b) Comment on whether the treatment effect appears to be practically significant.
(c) Identify one limitation that should be mentioned when reporting the result and suggest a reasonable next step for the researchers.
(4–6 marks)
(a)
1 mark: States that the interval gives a plausible range for the average reduction in blood pressure.
1 mark: Explains that if the study were repeated many times, 95% of such intervals would contain the true mean reduction.
1 mark: Describes the meaning in non-technical language.
(b)
1 mark: Correctly comments on practical significance, such as noting that although the interval excludes zero, the size of the effect must be judged in a medical context.
1 mark: Identifies whether the range (1.2–6.8 mmHg) suggests a meaningful improvement.
(c)
1 mark: Identifies a reasonable limitation (e.g., small sample size, lack of random sampling, measurement variability).
1 mark: Suggests an appropriate next step (e.g., collect a larger sample, conduct a randomised trial, improve measurement accuracy).
