
AP Syllabus focus:
‘Null and Alternative Hypotheses for Homogeneity
- Null Hypothesis (H0): There is no difference in distributions of a categorical variable across populations or treatments.
- Alternative Hypothesis (Ha): There is a difference in distributions of a categorical variable across populations or treatments.
-Null and Alternative Hypotheses for Independence
- Null Hypothesis (H0): There is no association between two categorical variables in a given population, or the two variables are independent.
- Alternative Hypothesis (Ha): Two categorical variables in a population are associated or dependent.’
Understanding how to correctly state hypotheses is essential because chi-square procedures rely on comparing observed categorical patterns to expectations under assumptions of sameness or independence.
Distinguishing Chi-Square Hypotheses
Formulating hypotheses in chi-square testing requires recognizing whether the research question addresses differences in distributions or relationships between variables. In both cases, the hypotheses describe statements about population-level behavior rather than characteristics of the sample.
The Role of the Null Hypothesis
The null hypothesis asserts a statement of no effect, no difference, or no association. It provides the expected pattern of categorical outcomes that serves as the baseline for comparing observed data. Because chi-square tests evaluate deviations between observed and expected counts, the null hypothesis must explicitly describe what “no deviation” would look like in the population.
Null Hypothesis (H0): A statistical statement proposing that any observed differences in categorical outcomes arise solely from random variation rather than a real effect.
After the null hypothesis is defined, the alternative hypothesis offers a competing claim suggesting that a meaningful difference or association exists in the population.
The Role of the Alternative Hypothesis
The alternative hypothesis describes the presence of a difference or association that contradicts the null. For chi-square tests, this hypothesis is intentionally broad because the test does not specify the direction or nature of the deviation—only that at least one category behaves differently than expected.
Alternative Hypothesis (Ha): A statistical statement proposing that observed differences in categorical outcomes reflect a real departure from the pattern described by the null hypothesis.
A chi-square test compares observed counts to expected counts derived from the null hypothesis, enabling evaluation of how well each hypothesis aligns with the data.
Hypotheses for Chi-Square Test for Homogeneity
A chi-square test for homogeneity evaluates whether multiple populations or treatments share the same distribution of a categorical variable. The hypotheses formalize whether the distributions are identical or differ in at least one category.
Null and Alternative Structures for Homogeneity
The null hypothesis states that all populations or treatment groups have the same true category proportions, meaning the distributions do not differ meaningfully.
The alternative hypothesis states that at least one population has a different distribution, indicating a difference in proportions across categories.
Key points:
The test concerns multiple groups and one categorical variable.
The hypotheses refer to population distributions, not sample patterns.
A rejection of the null implies a meaningful population difference in at least one category.
Statement Requirements
When expressing hypotheses:
Use population language (e.g., “in the populations under study”).
Do not specify which category differs; chi-square tests are non-directional.
Ensure wording reflects comparison across groups rather than variables.
Hypotheses for Chi-Square Test for Independence
A chi-square test for independence assesses whether two categorical variables are associated within a single population. The hypotheses describe whether knowing the value of one variable provides information about the other.
Null and Alternative Structures for Independence
The null hypothesis states that the two variables are independent, meaning the distribution of one variable does not differ across levels of the other.
For a chi-square test for independence, the null hypothesis states that there is no association between the two categorical variables in the population (they are independent).
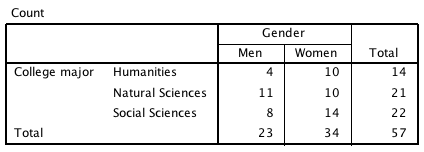
A contingency table illustrating how two categorical variables—here, gender and major—are cross-classified when stating hypotheses for a chi-square test of independence. Source.
The alternative hypothesis states that the variables are associated, indicating dependence between them.
Key points:
The test concerns one population and two categorical variables.
Independence implies no predictive or relational link between variables.
A rejection of the null suggests the presence of an association but does not specify its form.
Statement Requirements
When writing hypotheses:
Frame the null as “no association” or “independence.”
Frame the alternative as “an association exists” or “the variables are dependent.”
Avoid directional or causal phrasing, as the chi-square test neither evaluates causation nor indicates which variable influences the other.
Comparing Hypotheses Across the Two Chi-Square Tests
Although both chi-square tests evaluate categorical data using similar statistical procedures, the hypotheses target distinct conceptual questions. A clear comparison helps prevent common student errors.
Key distinctions:
Homogeneity focuses on comparing distributions across multiple populations.
Independence focuses on determining whether two variables within one population are associated.
In both tests, the null hypothesis describes uniformity—either uniformity of distributions or uniformity of variable relationships.
The alternative hypothesis is intentionally general to allow detection of any significant deviation from expectations.
Under the alternative hypothesis for either test, we expect the distribution of the categorical variable to differ across groups or across levels of the other variable, so the conditional distributions are not all the same.
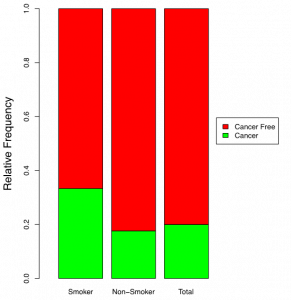
A segmented bar chart demonstrating how conditional distributions differ across groups when variables are associated, visually supporting the interpretation of alternative hypotheses in chi-square testing. Source.
Bullet-point summary of hypothesis components:
Null Hypothesis (H0):
Homogeneity: no difference in population distributions.
Independence: no association between variables.
Alternative Hypothesis (Ha):
Homogeneity: at least one population distribution differs.
Independence: variables are associated or dependent.
Understanding how to identify and articulate these hypotheses ensures that each chi-square test is applied appropriately and interpreted correctly within the context of categorical data analysis.
FAQ
Hypotheses should be precise enough to describe the population claim being tested but broad enough to reflect the non-directional nature of chi-square procedures.
Avoid naming specific categories or predicting which ones will differ.
Instead, focus on the overall structure of sameness (homogeneity) or independence (no association).
A well-written hypothesis states a population-level pattern without over-specifying outcomes.
Chi-square tests evaluate whether observed counts differ from expected counts, not the direction or size of the difference.
Because expected values vary across categories, chi-square procedures sum contributions from all categories collectively.
As a result, hypotheses must remain general, stating only that some difference or association exists, not how or where it appears.
Look at the structure of the data being collected.
• If one categorical variable is measured across two or more populations or treatment groups, the question concerns homogeneity.
• If two categorical variables are measured within a single population, the question concerns independence.
Identifying which scenario applies is essential because it changes the form of the hypotheses.
Statistical inference aims to generalise beyond the observed data.
A hypothesis about the sample would merely describe what has already been observed and would not provide a basis for inferential testing.
Therefore, hypotheses must describe population-level relationships or distributions, while sample data are used only to evaluate evidence for or against those claims.
Several recurring mistakes include:
• Writing hypotheses in terms of sample counts or percentages instead of population proportions.
• Predicting the direction of the association, which chi-square methods cannot test.
• Stating overly detailed alternatives such as “Group A has a higher proportion than Group B,” which is inappropriate for a chi-square test.
Clear, general wording aligned with the test’s purpose avoids these errors.
Practice Questions
Question 1 (1–3 marks)
A researcher wants to determine whether there is an association between students’ preferred study environment (silent, quiet, or social) and their year group in a secondary school.
State appropriate null and alternative hypotheses for a chi-square test for independence.
Question 1
• 1 mark: Null hypothesis correctly stated as no association between study environment and year group.
• 1 mark: Alternative hypothesis correctly stated as an association between study environment and year group.
• 1 mark: Correct use of population-level language (e.g., referring to the population of students rather than the sample).
Question 2 (4–6 marks)
A public health analyst collects data from three regions to investigate whether the distribution of vaccination status (fully vaccinated, partially vaccinated, not vaccinated) is the same across the regions.
(a) Identify whether a chi-square test for homogeneity or a chi-square test for independence should be used.
(b) State the null and alternative hypotheses for the appropriate test.
(c) Briefly explain, in context, what it would mean if the null hypothesis were rejected.
Question 2
(a)
• 1 mark: Identifies chi-square test for homogeneity because distributions across different regions are being compared.
(b)
• 1 mark: Null hypothesis correctly stated as no difference in the distribution of vaccination status across the three regions.
• 1 mark: Alternative hypothesis correctly stated as at least one region having a different distribution of vaccination status.
• 1 mark: Uses appropriate population wording (e.g., refers to true distributions in the regions).
(c)
• 1 mark: Correct explanation that rejecting the null suggests the distribution of vaccination status differs between at least some regions.
• 1 mark: Explanation is clearly contextualised (mentions regions and vaccination status).
