
AP Syllabus focus:
‘Introduction to the range of inference procedures available for categorical data analysis. Emphasizes the importance of understanding when each procedure is applicable, including chi-square tests for goodness-of-fit, independence, and homogeneity, as well as tests for comparing proportions. Focus on the criteria for selecting the appropriate test based on the research question, the type of data available, and the conditions under which the data were collected.’
Understanding the range of inference procedures for categorical data helps students choose statistical methods that match research aims, sampling structures, and variable types effectively.
Overview of Categorical Inference Procedures
Categorical inference procedures allow analysts to determine whether observed patterns in proportions, counts, or relationships between categories provide evidence for population-level claims. AP Statistics emphasizes that proper method selection depends on the research question, the type of categorical variable(s) involved, and the conditions under which data were collected. Because categorical data take the form of frequency counts rather than numerical measurements, inference procedures focus on comparing distributions or assessing associations rather than estimating means.
Key Categories of Inference Procedures
Several major inference procedures apply to categorical data, each addressing a distinct analytical purpose. Misapplying these techniques can lead to invalid conclusions, so it is essential to distinguish their goals clearly.
Chi-Square Tests
Chi-square procedures are fundamental for analyzing categorical data because they quantify how much observed counts differ from expected counts under a specified model. Each chi-square test serves a different question:
Chi-Square Test for Goodness-of-Fit
Examines whether the distribution of a single categorical variable matches a hypothesized distribution. It uses expected counts based on proposed population proportions.
Chi-Square Test for Independence
Assesses whether two categorical variables are associated within one population. It uses a two-way table to compare observed and expected counts assuming independence.
Chi-Square Test for Homogeneity
Compares whether multiple populations share the same distribution of a categorical variable. Although mathematically identical to the test for independence, its purpose differs because it compares groups selected separately.
These tests rely on expected counts being sufficiently large to justify use of the chi-square distribution.
All chi-square procedures are based on the same family of chi-square distributions, which are right-skewed and indexed by their degrees of freedom.
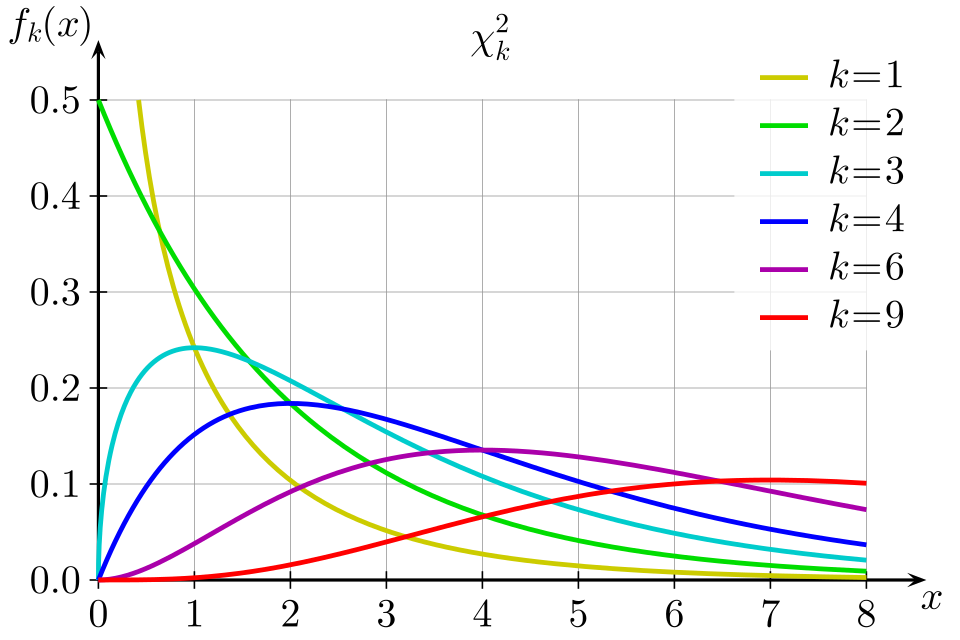
This figure shows chi-square distributions for several degrees of freedom. As the degrees of freedom increase, the curves become less skewed and shift rightward, illustrating how distribution shape influences p-value calculations. The image includes additional curves not specifically referenced in the syllabus but remains fully aligned with chi-square concepts used in AP Statistics. Source.
Additional Inference Procedures for Categorical Data
In addition to chi-square procedures, categorical analysis includes inference about proportions, which is appropriate when interest centers on estimated probabilities rather than distributions of counts.
One-Sample Inference for a Proportion
Used to test or estimate a single population proportion. Unlike chi-square tests, this method focuses on continuous sampling distributions for sample proportions rather than on count discrepancies.
Population Proportion: The long-run relative frequency of a category in the population.
Because one-sample inference uses a z-test for a proportion, it addresses research questions framed around estimating or testing a single probability rather than comparing entire distributions.
A normal sentence appears here to maintain required spacing.
Two-Sample Inference for Comparing Proportions
Two-sample procedures evaluate whether two groups have different population proportions for a binary categorical variable. This method is appropriate when comparing, for example, two treatments or two demographic groups.
Difference in Population Proportions: The contrast between two population probabilities, often denoted .
These methods differ from chi-square tests because they estimate or test differences rather than evaluate multi-category distributions.
Matching Procedures to Research Questions
Selecting the correct inference procedure requires recognizing how the research question structures the variables and the relationships of interest. AP Statistics highlights the importance of determining whether the data involve one categorical variable or two categorical variables, and whether the goal is comparison, association, or goodness-of-fit.
When the Goal Is To Assess Distributional Fit
A chi-square goodness-of-fit test is appropriate when the question asks whether observed counts align with a specified distribution. This applies only to single variables with two or more categories.
When the Goal Is To Compare Distributions Across Groups
If separate groups or treatments are being compared, a chi-square test for homogeneity allows analysts to determine whether the distributions differ. This procedure requires that each group be sampled independently.
When the Goal Is To Assess Association
A chi-square test for independence applies when all data come from one population and the question concerns whether the two categorical variables are statistically associated.
When the Goal Is To Estimate or Test a Proportion
Use one-sample or two-sample inference for proportions when:
The variable is binary.
The interest lies in estimating a probability or comparing two probabilities.
The structure does not involve multi-category distributions.
For chi-square tests of independence and homogeneity, and for many comparisons of proportions, we organize categorical data in a two-way (contingency) table with one variable in rows and the other in columns.
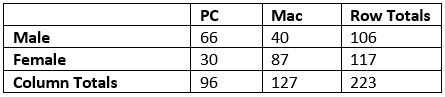
This contingency table displays counts classified by gender and computer type, illustrating how two-way tables structure joint frequencies for categorical variables. Such tables form the basis for chi-square tests of independence or homogeneity. The specific retail context is not required by the syllabus but serves as a clear and accessible illustration of the table format. Source.
Conditions Required for Categorical Inference
Understanding inference procedures also means recognizing the assumptions that ensure valid conclusions. The AP syllabus stresses that the conditions under which data were collected guide test selection.
Randomness and Independence
Most procedures require random sampling or random assignment, ensuring unbiased estimation and allowing generalization to populations.
Sample Size Requirements
For chi-square tests, expected counts must be large enough—generally at least 5—to justify using the chi-square distribution.
For proportion-based inference, sample sizes must allow the sampling distribution of the sample proportion to be approximately normal.
Integrating Procedure Selection in Practice
Evaluating categorical data involves aligning the statistical method with the research intent, the data structure, and assumptions about sampling. Understanding the full range of available procedures ensures students can identify which test appropriately answers the research question and meets the conditions for reliable inference.
FAQ
A chi-square test is preferable when the variable of interest has more than two categories or when you are comparing full distributions rather than a single proportion.
A two-proportion z-test is used only when the variable is binary and the research question explicitly focuses on comparing two probabilities.
If the question concerns association between two variables or differences across multiple groups, this points towards a chi-square procedure.
The number of variables determines whether you are analysing a single distribution or a relationship between variables.
For example:
• One variable with multiple categories typically leads to a goodness-of-fit test.
• Two variables require either a test for independence (one population) or homogeneity (multiple populations).
Failing to establish this distinction can result in applying an inference method that does not address the research question.
Both tests use identical calculations, but their interpretations differ.
Choose a chi-square test for independence when exploring whether two categorical variables are associated within the same population.
Choose a chi-square test for homogeneity when comparing distributions of a categorical variable across two or more separate populations or treatment groups.
The research question clarifies whether the focus is on association or comparison.
Expected counts reveal whether the assumptions underlying the chi-square approximation are likely to be met.
If several expected counts fall below 5, the test may produce inaccurate p-values.
By checking expected counts beforehand, you determine whether:
• The sample size is adequate
• Categories should be combined
• An alternative test may be more appropriate
This ensures more reliable inference.
Different inference procedures rely on different sampling structures.
• Test for independence requires a simple random sample from one population.
• Test for homogeneity requires independent samples from multiple populations or from multiple treatment groups in a randomised experiment.
The chosen procedure must reflect how the data
Practice Questions
Question 1 (1–3 marks)
A researcher records data on two categorical variables from a single random sample and wants to determine whether the variables are associated.
(a) Which inference procedure should the researcher select? (1 mark)
(b) State one condition that must be met for this procedure to be valid. (1 mark)
(c) Briefly explain why this procedure, rather than a chi-square test for homogeneity, is appropriate. (1 mark)
Question 1
(a) 1 mark
• Correct answer: Chi-square test for independence.
(b) 1 mark
• Any one valid condition, such as:
– Data must come from a random sample.
– Expected counts in all cells should be greater than 5.
– Observations must be independent.
(c) 1 mark
• Explanation that the independence test is used when examining association within a single population, whereas the homogeneity test compares distributions across multiple populations or groups.
• Award the mark for clearly identifying that only one population/sample is involved here.
Question 2 (4–6 marks)
A school compares three different year groups to see whether the proportion of students who prefer online homework platforms differs across the groups.
(a) Identify the most appropriate inference procedure for analysing these data. (1 mark)
(b) Explain why this procedure is suitable for the structure of the data collected. (2 marks)
(c) State two conditions required for this inference procedure to be valid, and explain why each condition matters. (2 marks)
(d) Describe how expected counts would be used in carrying out this test. (1 mark)
Question 2
(a) 1 mark
• Correct answer: Chi-square test for homogeneity.
(b) 2 marks
• 1 mark for stating that the data come from multiple groups or populations (the three year groups).
• 1 mark for explaining that the goal is to compare distributions of a categorical variable across these groups.
(c) 2 marks
Award 1 mark for each valid condition with explanation. Examples:
• Random sampling or random assignment: ensures conclusions can be generalised to the populations.
• Expected cell counts greater than 5: ensures the chi-square approximation is accurate.
• Independence of observations: prevents bias due to related data points.
(d) 1 mark
• Expected counts are calculated to represent what would occur if all groups had the same distribution; they are then compared with observed counts using the chi-square statistic.
• Award the mark for clearly stating that the expected counts act as the benchmark for evaluating differences among the groups.
