
AP Syllabus focus:
‘Variation in the positioning of points relative to a theoretical line in scatter plots may suggest randomness or a pattern. Students should learn to observe scatter plots and identify whether the variation seems random or if there appears to be a discernible pattern or trend that deviates from randomness. This identification is crucial for understanding the underlying relationships between variables and for deciding on further statistical analysis methods.’
Scatter plots reveal how two quantitative variables relate, and recognizing whether point variation is random or patterned helps determine appropriate questions for deeper statistical investigation.
Understanding Scatter Plot Variation
Variation in a scatter plot refers to how far individual data points fall from a theoretical line, often a line suggesting a possible linear association. Observing this variation is essential because it determines whether the relationship between variables appears meaningful or merely the result of random fluctuations. Students must develop the ability to distinguish between randomness and structured patterns in order to formulate productive statistical questions.
Random vs. Non-Random Variation
A key analytical step is evaluating whether the scatter plot shows random variation, meaning the points appear scattered without direction, or non-random variation, where a recognizable pattern or trend emerges.
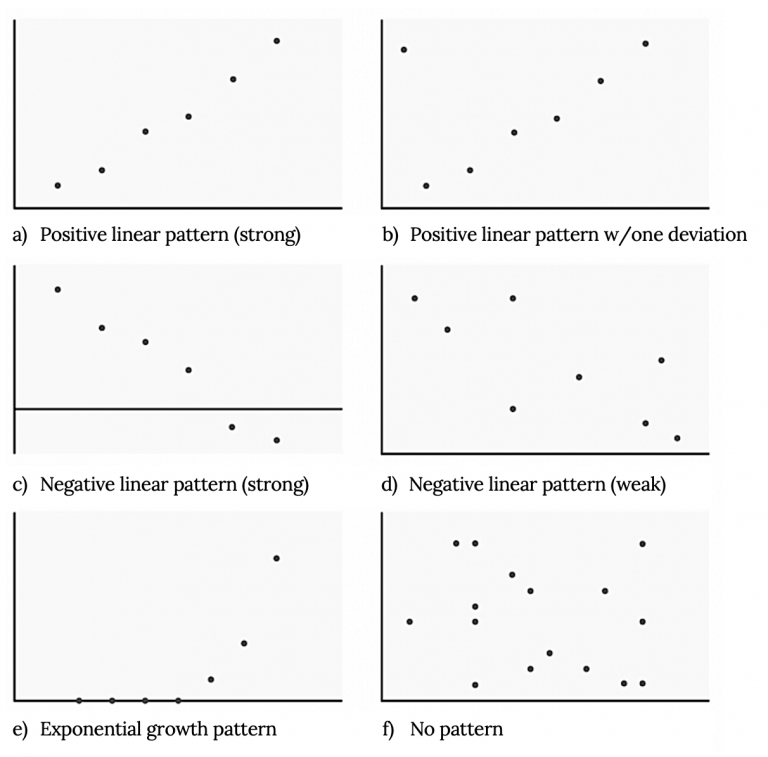
A set of scatterplot panels comparing strong and weak linear trends, a curved pattern, and random scatter. This visual highlights how structured or unstructured point arrangements relate to potential associations between variables. The exponential-growth example contains extra detail beyond the syllabus but reinforces the concept of identifiable patterns. Source.
Random Variation: Differences in data points that arise from natural chance processes, showing no consistent direction or shape around a theoretical line.
After identifying the presence or absence of structure, students can decide which types of statistical questions are justified. A pattern that deviates from randomness typically signals that the variables may be related in a meaningful way.
Identifying Questions Suggested by Scatter Plot Features
Scatter plot variation offers clues that guide the development of statistical questions. When students observe the behavior of plotted points, they should consider how the variation relates to potential underlying mechanisms or relationships between variables.
Questions Prompted by Apparent Patterns
Non-random structure invites deeper inquiry. Relevant questions may center on the strength, direction, or form of a possible relationship. These questions often focus on whether a systematic trend exists and what that trend implies about how one variable responds to changes in another.
Students should consider:
Is there evidence of a linear trend?
A clear upward or downward path suggests a potential linear association worth quantifying.Does the spread of points change across values of x?
Unequal spread can raise questions about whether variability depends on the level of the explanatory variable.Are clusters or curved shapes visible?
Groupings or curves may indicate subpopulations, nonlinear relationships, or hidden variables.Do any points deviate sharply from the general pattern?
Large deviations motivate questions about outliers and their causes.
Questions Prompted by Apparent Randomness
When a scatter plot exhibits primarily random variation, questions shift from searching for a relationship to investigating why no apparent relationship exists or whether additional data might reveal structure. Students might ask whether measurement error, insufficient sample size, or irrelevant variable selection could explain the randomness.
Observing Positioning Relative to a Theoretical Line
A theoretical line—often a conceptual version of a regression line—serves as a reference for judging variation.
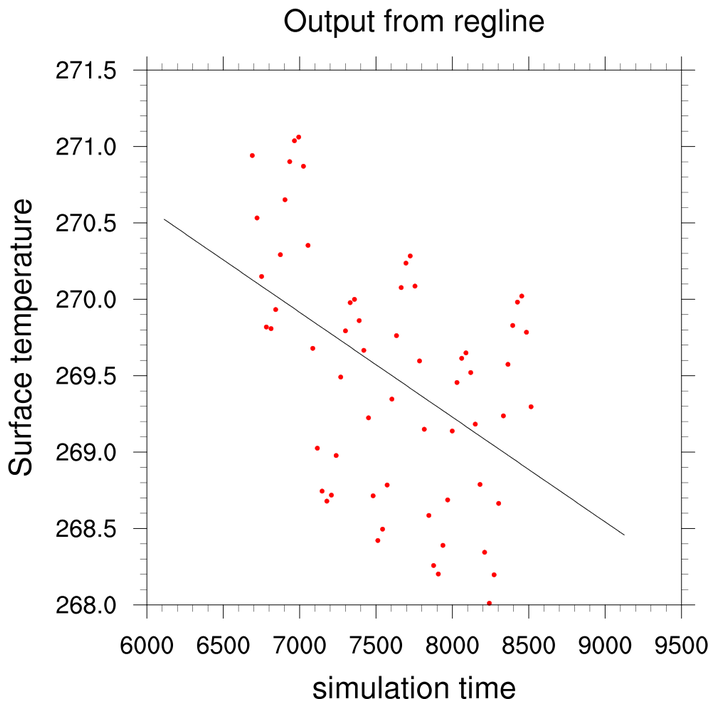
A scatterplot with a fitted regression line illustrating how observed data deviate above and below a theoretical linear relationship. The spread of points around the line demonstrates how variation is used to judge randomness and structure. The real-world labels (simulation time and surface temperature) provide additional context not required by the syllabus. Source.
Points that fluctuate widely and unpredictably around this line suggest randomness, while systematic deviations imply a potential relationship worth analyzing further.
Using Deviation Patterns to Guide Inquiry
Deviation patterns can point students toward specific statistical questions. For instance, consistent above-line or below-line groupings can lead to questions about factors influencing directional shifts. Irregular curvature encourages questions about whether a linear model is inappropriate.
Patterned Variation: Systematic, non-random point deviation from a theoretical line, indicating a potential relationship between variables.
These observed structures help determine whether further modeling or statistical testing is justified. The ability to articulate questions grounded in these observations is a foundational skill in AP Statistics.
Approaches to Observing and Interpreting Variation
Students should adopt a structured approach when examining a scatter plot. Doing so ensures that the questions they pose are based on thoughtful and systematic visual analysis.
Key Observational Steps
Assess overall direction to identify whether an increasing or decreasing trend is present.
Examine form, noting whether the pattern appears linear, curved, or absent.
Evaluate strength by judging how closely points cluster around an imagined line.
Inspect for anomalies, such as outliers, gaps, or clusters.
Consider context, ensuring that any question aligns with the meaning of the variables and the real-world situation.
Transforming Observations into Questions
Once variation is recognized, students should convert their observations into clear, analytical questions that guide subsequent statistical work. Examples include:
What type of relationship, if any, does the scatter plot suggest?
Does the magnitude of variation imply strong or weak association?
Could the observed pattern justify constructing a regression model?
Should additional variables or contextual factors be considered to explain the variation?
These questions embody the essential link between visual analysis and further statistical procedures. Understanding how scatter plot variation suggests relevant questions is foundational for exploring relationships, evaluating uncertainty, and determining appropriate next steps in data analysis.
FAQ
Look for any consistent directional tendency, even if faint. A weak pattern often shows a general upward or downward drift, whereas fully random scatter shows no such tendency.
You can also mentally sketch a rough line through the cloud of points:
If the line feels arbitrary, variation is likely random.
If the line captures a faint but repeatable trend, a weak pattern may exist.
Small effects, high natural variability, or measurement imprecision can obscure structure. Even when a relationship exists, noise may dominate the visible plot.
Patterns may also be masked when:
The range of x-values is narrow.
The variables relate only within certain intervals.
Subgroups exist but are not identified in the plot.
Context shapes which patterns are meaningful. The same visual pattern may imply very different questions depending on the subject matter.
For example:
In ecology, curved patterns might suggest biological limits.
In education, clusters may indicate ability groups.
In engineering, increasing spread could signal stress-threshold effects.
Yes. Apparent randomness may stem from small sample size or inadequate variable selection. Collecting more data can clarify whether variation is truly random or simply under-sampled.
Further data gathering is advisable when:
Measurement error is suspected.
The variables are believed to be related based on theory.
The scatter includes few points at extreme x-values.
Marking groups with different colours or symbols reveals patterns that may be hidden when points are uniform. What appears to be random variation might break into meaningful subpatterns across groups.
Such visual stratification helps detect:
Subpopulations with different relationships.
Overlapping trends that cancel out in the uncoloured plot.
Situations where a linear pattern exists only within specific categories.
Practice Questions
Question 1 (1–3 marks)
A researcher creates a scatter plot showing the relationship between time spent practising a musical instrument (in hours per week) and performance score on a standardised test. The points appear widely scattered with no clear upward or downward pattern.
a) What question might this scatter plot prompt the researcher to ask about the relationship between the two variables?
b) Explain briefly what the lack of a visible pattern suggests about the variation in the scatter plot.
Question 1 (1–3 marks)
a) 1 mark for a sensible question prompted by the scatter plot, such as:
“Is there any meaningful association between practice time and performance score?”
“Does increased practice time actually improve performance?”
“Could other variables explain the apparent lack of relationship?”
(Any relevant question earns 1 mark.)
b) 1–2 marks for recognising that:
The lack of pattern suggests mostly random variation. (1 mark)
There is little to no evidence of a linear relationship between the variables. (1 mark)
Total: 3 marks
Question 2 (4–6 marks)
A health analyst constructs a scatter plot comparing daily step count and resting heart rate for 40 adults. The points cluster loosely around a downward-sloping trend, though a few individuals fall far from the main group of points.
a) Identify two questions the analyst might ask based on the variation observed in the scatter plot.
b) Explain how the presence of a downward trend and the existence of outliers each provide different insights into possible underlying relationships between the variables.
c) Discuss how identifying patterned or random variation in this scatter plot could influence the decision to pursue further statistical modelling.
Question 2 (4–6 marks)
a) Up to 2 marks for two valid questions prompted by the scatter plot, such as:
“Does taking more steps per day lead to lower resting heart rate?”
“How strong is the downward trend between step count and resting heart rate?”
“Why do some individuals deviate significantly from the general pattern?”
(1 mark per appropriate question.)
b) Up to 2 marks for explaining the meaning of the features:
Recognising that the downward trend indicates a potential negative association (1 mark).
Explaining that outliers may represent unusual individuals, measurement issues, or additional variables affecting the relationship (1 mark).
c) Up to 2 marks for discussing how identifying variation informs modelling decisions:
Noting that patterned variation (the trend) suggests further analysis, such as fitting a regression model, might be worthwhile (1 mark).
Noting that random variation, especially if strong or influenced by outliers, may weaken the case for modelling or suggest the need for additional data or variables (1 mark).
Total: 6 marks
