
AP Syllabus focus:
‘The margin of error involves the critical t value and the standard error of the slope, SE = s/sqrt(n) for x's sample standard deviation. Standard error reflects the variability of slope estimates across samples.’
The margin of error for a regression slope quantifies uncertainty in estimating the population slope, helping students understand how sample variability affects confidence when interpreting linear relationships.
Understanding Margin of Error in Regression Slope Inference
The margin of error for the slope describes how far the estimated slope of a sample regression line may reasonably vary from the true population slope. Because the slope is derived from sample data, it is subject to natural sampling variation, and the margin of error provides a structured way to express this uncertainty within a confidence interval. Students should recognize that the margin of error depends on both the critical t value and the standard error of the slope, each playing a distinct role grounded in statistical reasoning.
Components of the Margin of Error
Two key elements determine the size of the margin of error:
The critical t value, reflecting the desired confidence level and degrees of freedom.
The standard error of the slope, capturing how much slope estimates fluctuate across repeated samples.
Understanding these components is essential for accurate interpretation of interval estimates.
The Standard Error of the Slope
The standard error of the slope is a measure of the expected variability in the slope estimate when sampling from the same population repeatedly. Because different samples produce different regression lines, the standard error summarizes this variation numerically and influences the precision of the interval.
Standard Error of the Slope: The typical amount by which sample slope estimates vary from the true population slope when random samples are repeatedly drawn.
The standard error incorporates the variability of the response variable, the spread of the explanatory variable, and the sample size. Larger sample sizes reduce this standard error, meaning estimates become more stable across samples.
EQUATION
= Standard error of the slope
= Standard deviation of residuals
= Sample size
The formula demonstrates that increasing the sample size decreases the denominator, reducing the standard error and narrowing the margin of error.
A crucial idea is that the standard error reflects not just measurement variation but the underlying randomness of sampling. Students should be attentive to this conceptual link because it underpins both estimation and hypothesis testing.
The Critical t Value
The critical t value identifies the number of standard errors needed to capture the desired confidence level. It comes from the t distribution with degrees of freedom, appropriate for simple linear regression. As confidence levels increase, the critical value increases, widening the margin of error to reflect greater certainty requirements.
Critical t Value: A multiplier from the t distribution indicating how many standard errors are needed to achieve a specified confidence level in interval estimation.
Between this definition and its use in the formula, students should appreciate the balancing act between certainty and precision.
Sentence identified for Image 2 insertion:
The critical value comes from a t-distribution with degrees of freedom and marks how far out into the tails we must go to capture the desired confidence level.*
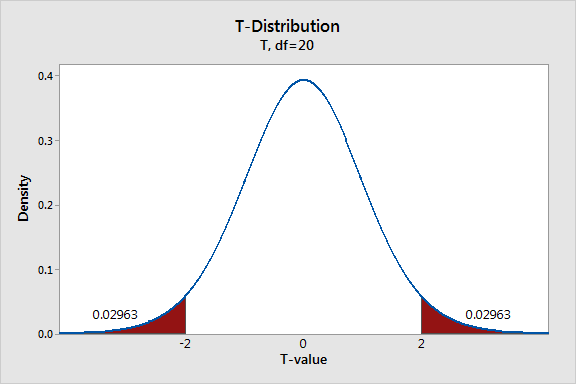
A t-distribution curve with shaded regions showing extreme t-values. The shaded tails represent how the critical value defines cutoff points needed to achieve a desired confidence level in slope estimation.* Source.
How the Margin of Error Is Formed
The margin of error combines the standard error of the slope and the critical t value. This combination indicates how far, in either direction, the estimated slope may reasonably fall from the true population slope under repeated sampling.
EQUATION
= Margin of error for the slope
= Critical t value for confidence level
= Standard error of the slope
Because the margin of error is part of the confidence interval expression, its magnitude directly affects the width of the interval. Recognizing this connection helps students interpret the practical implications of the margin of error when evaluating linear relationships.
Factors Influencing the Margin of Error
Several features of the data and chosen confidence level influence the final margin of error:
Sample size: Larger samples decrease the standard error, reducing the margin of error.
Variability in residuals: Greater residual spread increases the standard error, enlarging the margin.
Spread of x-values: A wider distribution of x-values typically produces a smaller standard error.
Confidence level: Higher confidence requires a larger critical t value.
These factors align with the syllabus emphasis on understanding the role of variability. Students should be able to articulate how each factor affects the margin of error and why these changes matter in applied contexts.
Why the Margin of Error Matters
The margin of error serves as an essential component of statistical inference because it quantifies uncertainty in slope estimates. By connecting observed sample data to the unknown population slope, it provides structured guidance for interpreting the strength and direction of linear relationships.
Sentence identified for Image 3 insertion:
Because the margin of error multiplies the standard error of the slope, larger or smaller values of lead to wider or narrower bands of plausible regression lines that are consistent with the data.
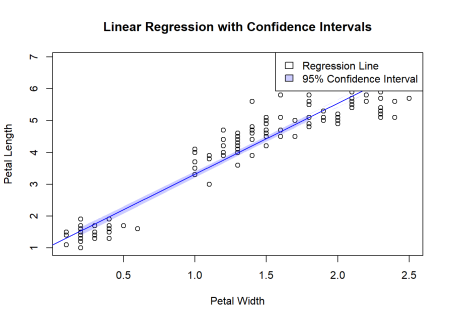
A regression line with a surrounding confidence band illustrates how uncertainty in the slope estimate produces a range of plausible lines. The band widens or narrows depending on the standard error and the critical value . This example uses the Iris dataset, which includes extra contextual detail not required by the syllabus.* Source.
FAQ
Outliers can inflate the spread of residuals, increasing the residual standard deviation. This leads directly to a larger standard error of the slope.
Outliers in the x-values also reduce the effectiveness of the explanatory variable in anchoring the regression line, potentially increasing variability in slope estimates.
When both types of outliers occur simultaneously, the standard error may increase substantially, making confidence intervals wider and less precise.
A greater spread in x-values gives the regression model more information about how y changes with x, leading to smaller variability in slope estimates.
When x-values are tightly clustered, small fluctuations in y can cause large changes in the slope, increasing its standard error.
As a result, datasets with a wider range of x-values typically yield more stable and precise slope estimates.
Yes. A small residual standard deviation does not guarantee a small margin of error.
This can happen when:
• The sample size is small, increasing the standard error.
• The critical t value is large due to low degrees of freedom.
• The range of x-values is narrow, limiting the model’s ability to estimate the slope precisely.
Even with well-behaved residuals, these factors can produce a wide margin of error.
Higher confidence levels require more certainty, which not only increases the critical value but also widens the conceptual range of plausible slopes.
A wider interval means the estimate must account for more extreme potential outcomes in repeated sampling.
For very high confidence levels (such as 99%), the increase in breadth becomes especially pronounced because the tails of the t distribution are heavier than those of the normal distribution.
Differences in the spread of the explanatory variable can dramatically affect the standard error of the slope.
If one study has a very narrow x-range, the regression line becomes more sensitive to small variations in y, inflating the margin of error.
Additionally, differences in the degrees of freedom (resulting from missing data, exclusions, or slight variations in sample size) can alter the critical t value, further widening or narrowing the margin of error.
Practice Questions
A researcher fits a least-squares regression line to a set of data and obtains a standard error of the slope equal to 0.12. The critical t value for a 95% confidence interval is 2.13.
(a) Calculate the margin of error for the slope.
(b) State what the margin of error represents in this context.
Question 1 (1–3 marks)
(a) Margin of error
• Correct computation: 2.13 × 0.12 = 0.2556 (accept 0.256 or 0.26).
1 mark.
(b) Interpretation
• States that the margin of error indicates how far the sample slope estimate may reasonably be from the true population slope.
• Refers to uncertainty or sampling variability.
1 mark.
• Total: 2–3 marks depending on accuracy and clarity.
(Full marks require correct calculation and a clear contextual interpretation.)
A study investigates the relationship between hours spent practising a musical instrument (x) and performance score on a standardised test (y). A regression analysis produces the following results:
• Estimated slope b = 1.8
• Standard error of the slope SE = 0.35
• For a 95% confidence interval, the critical t value is 2.12
(a) Compute the margin of error for the slope.
(b) Construct the 95% confidence interval for the slope.
(c) Interpret the interval in the context of the study.
(d) Explain how increasing the sample size would affect the margin of error, assuming all other factors remain the same.
Question 2 (4–6 marks)
(a) Margin of error
• Correct computation: 2.12 × 0.35 = 0.742 (accept rounding).
1 mark.
(b) Confidence interval
• Correct interval: 1.8 ± 0.742 → (1.058, 2.542) (accept small rounding differences).
1 mark.
(c) Interpretation
• States that the interval gives a plausible range of values for the true population slope.
• Links interpretation to the context (each additional hour of practice is associated with an increase of between approximately 1.06 and 2.54 points in performance score).
1–2 marks depending on clarity.
(d) Effect of increasing sample size
• States that increasing n decreases the standard error.
• Explains that a smaller standard error leads to a smaller margin of error.
1–2 marks depending on explanation quality.
• Total: 5–6 marks for accurate calculation, correct interval, appropriate contextual interpretation, and correct explanation of the effect of sample size.
