
AP Syllabus focus:
‘The width of a confidence interval for the slope decreases as the sample size increases, holding all else constant. This is due to the inverse relationship between sample size and the standard error of the slope estimate, affecting the precision of the interval estimate.’
Understanding how sample size influences the width of a confidence interval for a regression slope is essential for judging the precision and reliability of statistical estimates in linear models.
Effects of Sample Size on Confidence Interval Width
The behavior of confidence intervals in regression analysis reflects a central idea in statistics: larger samples typically provide more precise estimates. For the slope of a regression model, the AP Statistics specification emphasizes that increasing the sample size (n) narrows the confidence interval, assuming all other conditions remain fixed. This narrowing occurs because the standard error of the slope, which measures how much slope estimates vary from sample to sample, becomes smaller as more data are collected. A reduced standard error leads to a smaller margin of error and thus a tighter interval around the estimated slope.
Why Confidence Interval Width Matters
A confidence interval for the slope communicates the plausible values of the population slope (β) based on sample data.
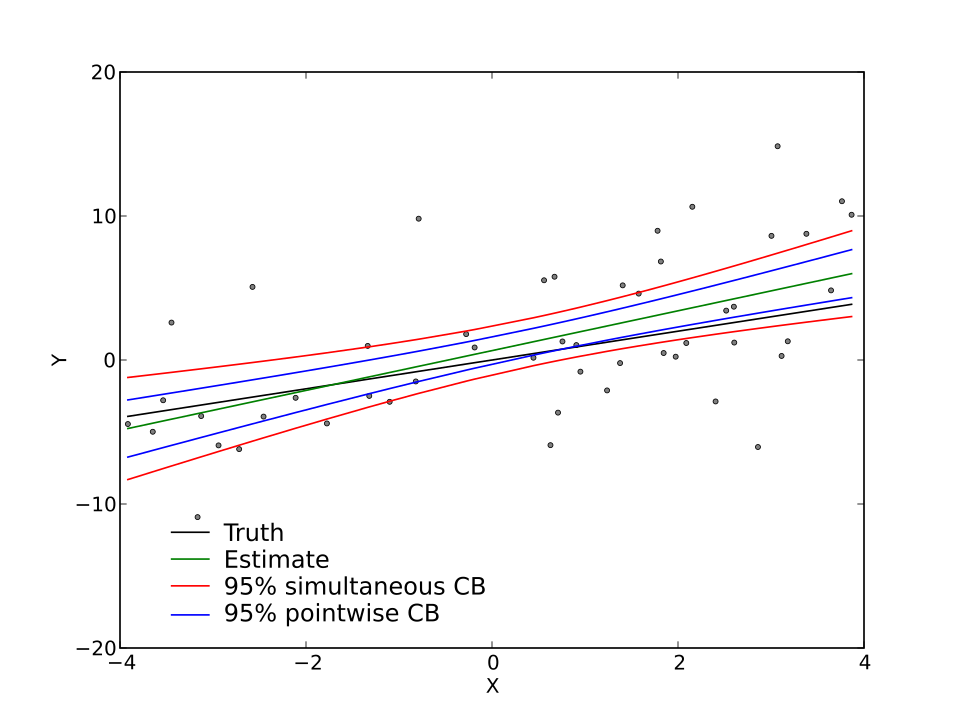
This figure shows a scatterplot with a regression line and surrounding confidence bands, illustrating the uncertainty in estimating the true population slope. The shaded regions represent ranges of plausible regression lines based on the data. Extra prediction-interval content appears in the image but remains helpful for contrasting different types of uncertainty. Source.
A narrow interval gives a more focused estimate of the true relationship between variables, improving interpretive clarity. A wide interval indicates more uncertainty and less stability in the slope estimate. Because sample size directly influences interval width, understanding this effect allows researchers to design studies capable of producing sufficiently precise results.
The Role of Standard Error in Interval Width
The primary mechanism linking sample size to interval width is the standard error of the slope, which quantifies the spread of estimated slopes across repeated samples.
Standard Error of the Slope: A measure of the variability of slope estimates across repeated random samples of the same size.
As the sample size increases, the denominator of the standard error formula grows, reducing the magnitude of the standard error. A smaller standard error reduces the width of the confidence interval because the margin of error becomes smaller.
EQUATION
= Critical value from the t-distribution for a chosen confidence level
= Standard error of the slope estimate
This connection highlights why large samples yield more precise slope estimates: the margin of error shrinks as the standard error shrinks.
A sentence helps transition before continuing deeper into the structural effects of sample size. As data quantity increases, the stability of the regression model generally strengthens, reinforcing the reliability of slope-based inferences.
How Sample Size Influences Precision
The inverse relationship between sample size and standard error means that even modest increases in sample size can meaningfully improve precision.
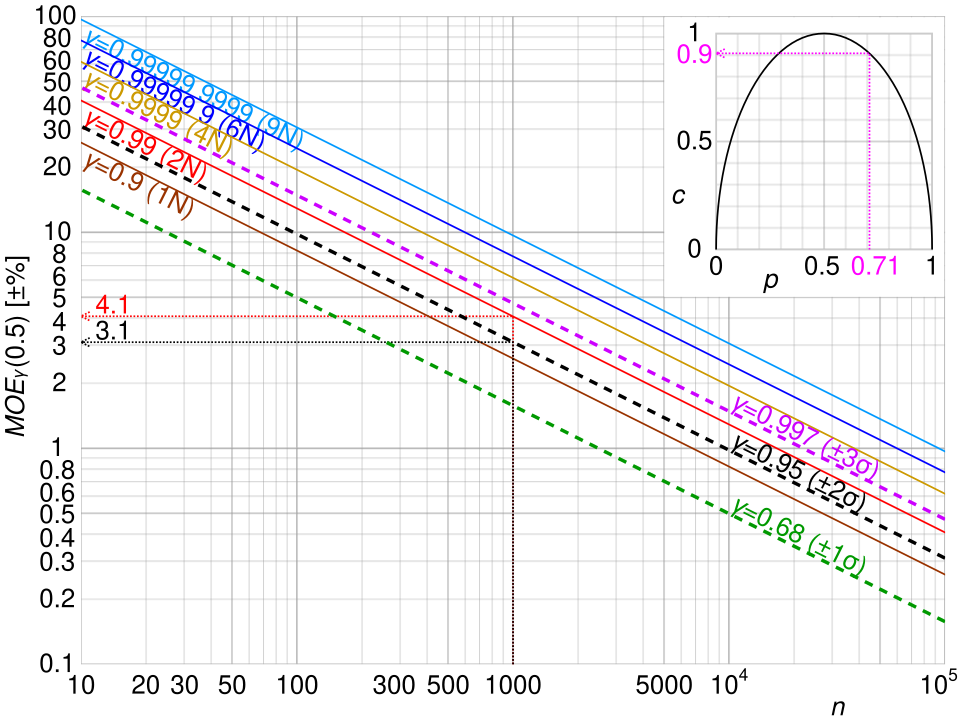
This plot illustrates how the margin of error declines as sample size increases, demonstrating why confidence intervals become narrower with more data. Multiple curves show the effect of different confidence levels, which is additional detail but reinforces how interval width depends on both sample size and confidence demands. Source.
Larger samples:
Reduce the variability in the sampling distribution of the slope.
Increase the stability of residual patterns.
Make the sampling distribution of the slope more closely approximate a t-distribution, especially when data may not be perfectly normal.
Because confidence intervals reflect the uncertainty surrounding parameter estimates, any reduction in that uncertainty directly narrows the interval.
Conceptualizing the Relationship
When sample size is small, each individual observation carries more weight, making estimates more sensitive to variation. As sample size grows, random fluctuations tend to cancel out. The slope estimate stabilizes, so the confidence interval becomes narrower.
Conditions and Assumptions Holding Constant
The specification states that the interval narrows holding all else constant, which assumes:
The relationship between variables remains linear.
The standard deviation of residuals does not change.
The level of confidence (e.g., 95%) stays the same.
The variability in x-values remains stable.
A larger sample cannot compensate for violations of conditions such as nonlinearity or heteroscedasticity. Instead, it improves precision only when the regression model is appropriate and conditions are reasonably met.
Implications for Study Design
Understanding the role of sample size helps researchers plan investigations that achieve desired precision levels. When anticipating whether a confidence interval will be sufficiently narrow to support meaningful conclusions, sample size becomes a key design choice. Larger samples allow:
More decisive interpretations about the strength and direction of relationships.
Greater ability to detect small but meaningful slopes.
Reduced risk of ambiguous or uninformative intervals.
Interpreting Interval Width in Context
The width of a confidence interval always must be interpreted relative to the real-world context of the variables. A narrow interval may still be practically insignificant, and a wide interval may still support useful conclusions depending on the research purpose. However, the mathematical relationship remains consistent: increasing sample size reliably narrows the confidence interval for the slope.
Summary of Key Effects
Larger sample size → smaller standard error → narrower confidence interval for β.
Precision improves because the slope estimate becomes more stable across repeated samples.
Interval width reflects both statistical uncertainty and data quality, but sample size is one of the most direct and controllable influences.
FAQ
The interval width decreases at a diminishing rate: early increases in sample size yield substantial reductions in width, whereas very large samples produce smaller incremental gains.
This occurs because standard error is inversely related to the square root of sample size. Doubling the sample does not halve the interval width but still meaningfully improves precision.
Only if model conditions remain appropriate. Larger samples cannot correct structural issues such as nonlinearity or strong outliers.
If violations persist, the slope estimate may become unstable, and the interval may narrow less than expected or even widen due to increased variability introduced by problematic data.
Sample size reduces random error, but the spread of x-values affects the precision of slope estimation. A wider range in x improves the ability to estimate the slope, independent of n.
If x-values cluster tightly, even a large sample may not produce a meaningfully narrower interval because limited variation constrains slope estimation accuracy.
Yes. Interval width depends not only on sample size but also on residual variability and the distribution of x-values in each sample.
If one sample has greater residual scatter or less variation in x, its interval for the slope will be wider even with identical n.
Larger samples produce intervals that fluctuate less from sample to sample, making the proportion of intervals capturing the true slope more consistent.
This improved stability strengthens inferential reliability, as repeated studies with large n generate intervals that are both narrower and more similar in width and location.
Practice Questions
Question 1 (1–3 marks)
A researcher constructs a 95% confidence interval for the slope of a regression line based on a sample of 20 observations. They repeat the study with a sample of 80 observations, keeping all other aspects of the study the same.
Explain how and why the width of the confidence interval for the slope will change when using the larger sample.
Question 1 (1–3 marks)
• 1 mark: States that the confidence interval becomes narrower with the larger sample.
• 1 mark: Explains that the standard error of the slope decreases with larger sample size.
• 1 mark: Links decreased standard error to reduced margin of error or increased precision.
Question 2 (4–6 marks)
A study investigates whether the amount of time students spend revising (in hours) is associated with their exam score. A researcher fits a regression model and calculates a 95% confidence interval for the slope using a sample of 25 students. The researcher argues that the interval is too wide to draw meaningful conclusions and considers increasing the sample size.
(a) Explain why increasing the sample size would affect the width of the confidence interval for the slope.
(b) Identify one assumption that must remain constant for this effect of sample size on interval width to hold.
(c) Suppose the researcher doubles the sample size. Explain qualitatively how this will influence the precision of the slope estimate and the interpretability of the interval in context.
Question 2 (4–6 marks)
(a)
• 1 mark: States that increasing sample size narrows the confidence interval.
• 1 mark: States that this occurs because the standard error of the slope decreases when sample size increases.
(b)
• 1 mark: Identifies a required assumption such as linearity, constant standard deviation, independence, or appropriate model conditions remaining unchanged.
(c)
• 1 mark: Explains that doubling the sample size increases precision of the slope estimate.
• 1 mark: States that the confidence interval becomes narrower, making the estimate more informative or reducing uncertainty.
• 1 mark: Provides a contextual explanation (e.g., giving a clearer sense of how revision time relates to exam scores).
