
AP Syllabus focus:
‘This subsubtopic focuses on the skill of understanding and selecting the appropriate inference procedure for analyzing quantitative data related to slopes. Concepts to be Covered:
- Emphasize the importance of understanding the different inference procedures available for analyzing quantitative data, specifically in the context of regression slopes.
- Discuss how to select the most suitable inference procedure based on the data type, research question, and conditions met by the dataset.
- Overview of inference procedures related to slopes, including confidence intervals for the slope, hypothesis testing for the slope, and determining the significance of the regression model.’
Understanding inference procedures for slopes helps students connect research questions, data conditions, and statistical goals to the correct analytical method for making justified claims.
Understanding Inference Procedures for Slopes
Inference procedures for slopes allow statisticians to use sample data to make evidence-based statements about the population regression slope, which represents the strength and direction of a linear relationship between two quantitative variables.
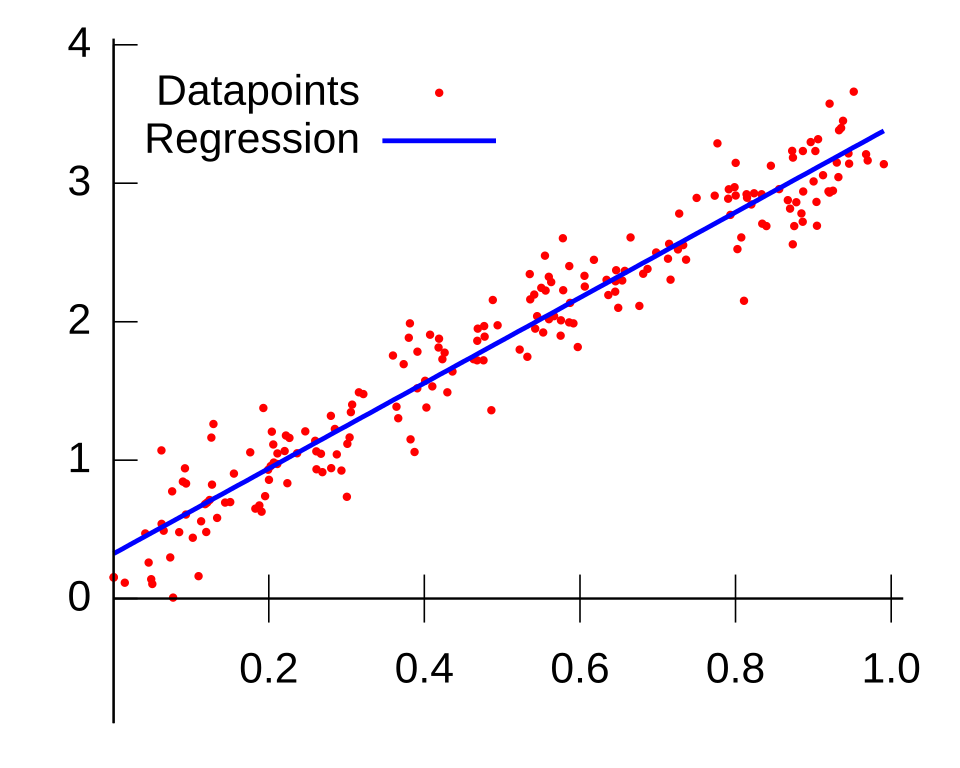
This figure shows a scatter plot of quantitative data with a fitted least-squares regression line. Each point represents an observed pair, and the line summarizes the overall linear trend. The diagram helps visualize the population and sample slopes that underlie the inference procedures discussed in this section. Source.
Why Inference Procedures Matter
Selecting an appropriate inference procedure ensures that conclusions about relationships in data are supported by valid statistical reasoning. Because sample data include variability, inference procedures help quantify uncertainty and evaluate whether observed patterns reflect genuine population trends.
Core Components of Inference for Slopes
To select an appropriate method, students must understand the role of the population slope (the true rate of change), the sample slope (an estimate based on collected data), and the assumptions that justify inferential conclusions.
Population Slope (β): The true slope of the regression line describing the linear relationship between a predictor variable and a response variable in the population.
Selecting a procedure requires linking the research objective—either estimating a parameter or testing a claim—to the proper inferential tool.
Types of Inference Procedures for Slopes
Three major inference procedures are relevant in AP Statistics when working with regression slopes.
Confidence Intervals for the Slope
A confidence interval for the slope is used when the goal is to estimate the plausible range of values for the population slope. This method acknowledges sampling variability by providing an interval expected to capture the true slope in a specified proportion of random samples.
EQUATION
= Sample slope
= Critical t-value based on confidence level and degrees of freedom
= Standard error of the sample slope estimate
Confidence intervals help determine whether the data provide evidence of a meaningful linear relationship in the population, based on whether zero or other hypothesized values fall within the interval.
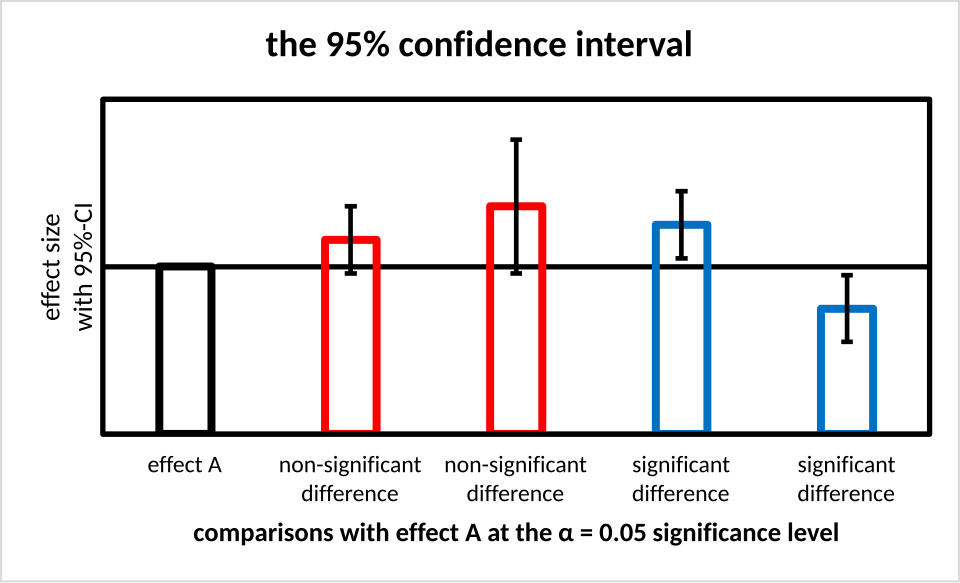
This bar chart displays sample estimates with 95% confidence intervals as vertical lines around each bar. The shaded intervals represent ranges of plausible parameter values, while intervals that do not cover the reference value highlight potential evidence against that value. Although the plot is drawn for means rather than slopes, the same confidence-interval logic applies to regression slopes in this unit. Source.
Hypothesis Testing for the Slope
A hypothesis test for the slope evaluates a claim about the population slope by comparing the observed sample slope to what would be expected if the null hypothesis were true. This method is appropriate when the research question concerns whether the slope differs from zero or another specified value.
Null Hypothesis (H₀): A claim stating that the population slope equals a specific value, often zero, indicating no linear association.
After stating hypotheses, students compute a test statistic that measures how many standard errors the sample slope is from the null value.
EQUATION
= Sample slope
= Hypothesized population slope under H₀
= Standard error of the slope
The p-value from this test assesses the strength of evidence against the null hypothesis by quantifying how likely such a result would be if the null were true.
Assessing Significance of the Regression Model
Inference procedures for slopes also help determine whether the sample provides evidence of a statistically significant linear relationship between variables. If the slope is significantly different from zero, the regression model suggests a meaningful association. This evaluation forms the basis of interpreting real-world patterns supported by sample data.
Selecting the Most Appropriate Procedure
Choosing the correct inference method requires careful attention to the research goal, the structure of the data, and the assumptions underlying linear regression.
Matching Procedure to Research Objective
Students should consider whether the purpose is to:
Estimate the slope (use a confidence interval)
Test a claim about the slope (use a hypothesis test)
Evaluate the overall presence of a meaningful linear relationship
Clear alignment between question type and method ensures the procedure appropriately addresses uncertainty.
Considering Data Conditions
Most slope-based inference procedures rely on the same assumptions because they use the t-distribution framework.
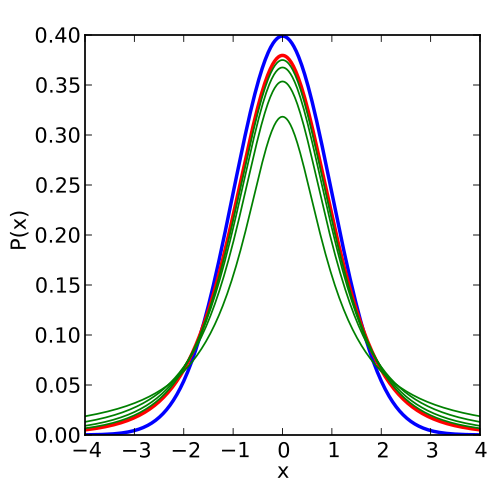
This plot shows the standard normal density curve alongside several Student’s t-distribution curves, including one with 5 degrees of freedom. The t-curves are more spread out and have heavier tails, reflecting extra uncertainty when parameters such as the standard deviation are estimated from the sample. These shapes underlie the critical values used in t-based confidence intervals and hypothesis tests for regression slopes; some curves correspond to degrees of freedom not specifically discussed in this subtopic. Source.
Students must verify the following to justify inferential conclusions:
Linearity: A straight-line pattern in the relationship between variables
Independence: Observations that do not influence one another
Constant Variability: Similar spread of residuals across values of the explanatory variable
Normality: Residuals that are approximately normal, especially for small samples
Meeting these conditions supports the validity of the inference procedure selected.
Integrating Understanding Across Procedures
A firm grasp of the purpose, assumptions, and outputs of each inference procedure allows students to determine which method best aligns with a dataset and research goal. Whether estimating slopes or testing hypotheses, understanding these procedures ensures accurate interpretation and stronger statistical reasoning.
FAQ
An inference procedure for the slope is needed when the goal is to generalise beyond the sample and make a claim about the population relationship.
If you only want to describe the sample pattern, the sample slope is sufficient.
Use inference when:
You must quantify uncertainty in the estimated slope.
You must evaluate whether the population slope differs from zero or another meaningful value.
The study design involves random sampling or random assignment, enabling population-level conclusions.
A confidence interval is more informative when you need a range of plausible values for the population slope, especially if multiple values could be scientifically or practically meaningful.
A hypothesis test is more informative when:
There is a specific claim to evaluate.
A decision threshold (such as stakeholder requirements) is already defined.
The aim is to establish the presence or absence of a relationship, not estimate its magnitude.
Regression inference relies on multiple assumptions about the form and structure of residuals, making violations more impactful.
Unlike some one-sample procedures, slope inference involves:
Modelling relationships rather than single distributions.
Residual behaviour that can shift across x-values.
Greater sensitivity to outliers, which can distort both the slope and its variability.
Checking conditions ensures that the t-distribution accurately reflects sampling variability in the estimated slope.
Certain problems may only become visible through deeper inspection, such as:
Influential outliers that heavily alter the slope but do not produce obvious residual-pattern violations.
A restricted range of x-values, which can artificially strengthen or weaken the apparent relationship.
Clustered data from subgroups that behave differently, invalidating a single linear model.
In such cases, alternative modelling approaches may be more appropriate.
Recognising why slope inference exists enables clearer judgement about whether claims are statistically and practically justified.
A well-chosen inference procedure supports:
Transparent reporting of uncertainty in trend estimates.
Distinguishing between statistically detectable effects and trivial real-world impacts.
Assessing whether study designs are strong enough to generalise beyond the sample.
This enhances the ability to critically evaluate scientific, economic, or social research that relies on linear relationships.
Practice Questions
Question 1 (1–3 marks)
A researcher wants to determine whether a linear relationship exists between the number of hours students revise and their exam scores. Before conducting any statistical test, the researcher must choose an appropriate inference procedure for the slope of the regression line.
State which inference procedure is appropriate and briefly explain why it is suitable in this context.
Question 1 (1–3 marks)
1 mark for identifying an appropriate inference procedure:
A t-based inference procedure for the slope of a least-squares regression line (e.g., confidence interval for the slope or hypothesis test for the slope).
1 mark for explaining suitability:
It estimates or evaluates the population slope using sample data in a linear relationship.
1 mark for mentioning conditions or regression context:
Conditions for linear regression inference apply (linearity, independence, constant variance, normality of residuals).
(Max 3 marks)
Question 2 (4–6 marks)
A study investigates whether the amount of fertiliser applied (in grams) predicts the height of plants (in centimetres) after six weeks. The researcher collects a random sample of plant measurements and verifies that the conditions for linear regression inference are met.
(a) Explain how the researcher would decide whether to construct a confidence interval for the slope or carry out a hypothesis test for the slope.
(b) Identify two conditions that must be checked before selecting an inference procedure for the slope, and explain why each condition is important.
(c) Describe how the t-distribution is involved in the inference procedure for the regression slope.
Question 2 (4–6 marks)
(a) Up to 2 marks
1 mark: Confidence interval is selected when the aim is to estimate the population slope.
1 mark: A hypothesis test is selected when the aim is to assess evidence for or against a specific claim about the slope.
(b) Up to 2 marks
Award 1 mark each for any two valid conditions with explanations, e.g.:
Linearity: Ensures a straight-line model is appropriate for describing the relationship.
Independence: Prevents bias from related observations.
Constant variability: Ensures residuals have equal spread for all x-values.
Normality of residuals: Justifies using t-distribution for inference, especially with small samples.
(c) Up to 2 marks
1 mark: States that the test statistic or confidence interval uses a t-distribution.
1 mark: Explains that degrees of freedom are n − 2, and the t-distribution accounts for estimating variability from the sample.
(Max 6 marks)
