
AP Syllabus focus:
‘Students practice applying the learned objectives relating to inference, focusing on quantitative data and slopes. Concepts to be Covered:
- Provide examples and exercises for applying different inference procedures to datasets involving quantitative data and slopes.
- Detailed walkthroughs of scenarios where students must decide which inference procedure to apply based on specific objectives, such as estimating parameters or testing hypotheses regarding the slope of a regression model.
- Emphasize the criteria for choosing one procedure over another, including the type of data, the research question, and the assumptions or conditions that are satisfied.’
Application of inference procedures for regression slopes requires selecting methods that match research goals, verifying assumptions, and interpreting results that meaningfully address questions about quantitative relationships.
Applying Inference Procedures to Quantitative Data and Slopes
This subsubtopic emphasizes the practical use of inference procedures in contexts involving linear regression slopes. Students move beyond identifying methods to actively choosing and applying the correct statistical approach based on a dataset’s characteristics and the research question. Because regression analysis explores how one quantitative variable predicts another, correct application ensures that inferences about the population slope are justified and statistically sound.
Understanding the Purpose of the Inference Procedure
Inference about a regression slope typically addresses one of two goals:
Estimating a population slope using a confidence interval
Testing a claim about a population slope using a significance test
To apply these procedures effectively, students must first determine whether the objective is estimation or hypothesis testing, because each requires different reasoning, interpretations, and outputs.
Key Components in Applying Inference Procedures
Several essential ideas guide the application of inference procedures for slopes. Students must integrate knowledge of regression, sampling variation, and statistical modeling into a coherent decision-making process.
Identify whether the relationship between variables appears linear, making regression modeling appropriate.
Determine whether the goal concerns the precision of the slope estimate or the evaluation of a specific claim.
Assess whether the data satisfy the necessary conditions for inference, such as independence and constant variability.
Select the correct method based on these factors and apply it consistently.
A clear understanding of what the slope represents—the predicted change in the response variable for a one-unit increase in the explanatory variable—helps guide appropriate use of inference procedures.
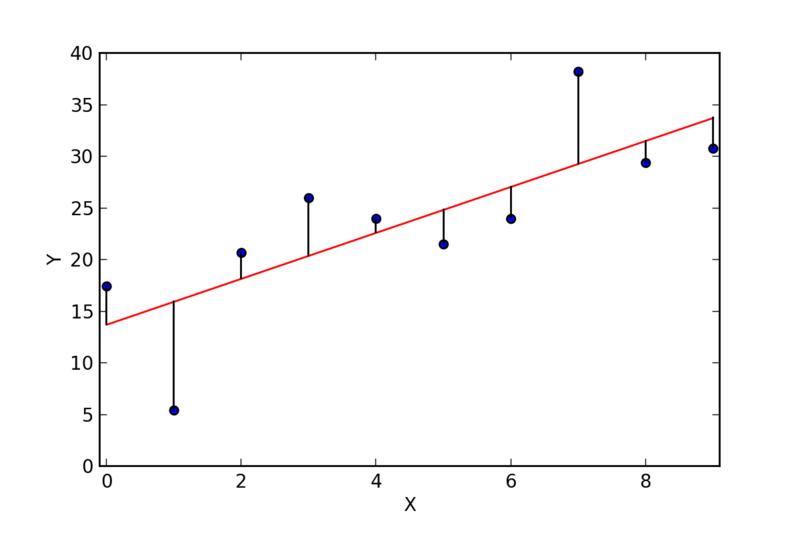
This diagram shows a least-squares regression line fitted to a set of points, with vertical line segments indicating the residuals for each observation. The slope of the red line captures the systematic linear trend, while the residuals measure how far individual points depart from that trend. This visualization reinforces the idea that inference procedures for the slope are built on how these residuals behave. Source.
Critical Conditions Required Before Application
Before any inference procedure can be applied, students must verify whether the dataset meets the assumptions that justify regression inference. These conditions ensure that resulting intervals or tests accurately reflect the underlying variability in slope estimates.
Linearity: The relationship between x and y should be reasonably linear, often checked with a residual plot.
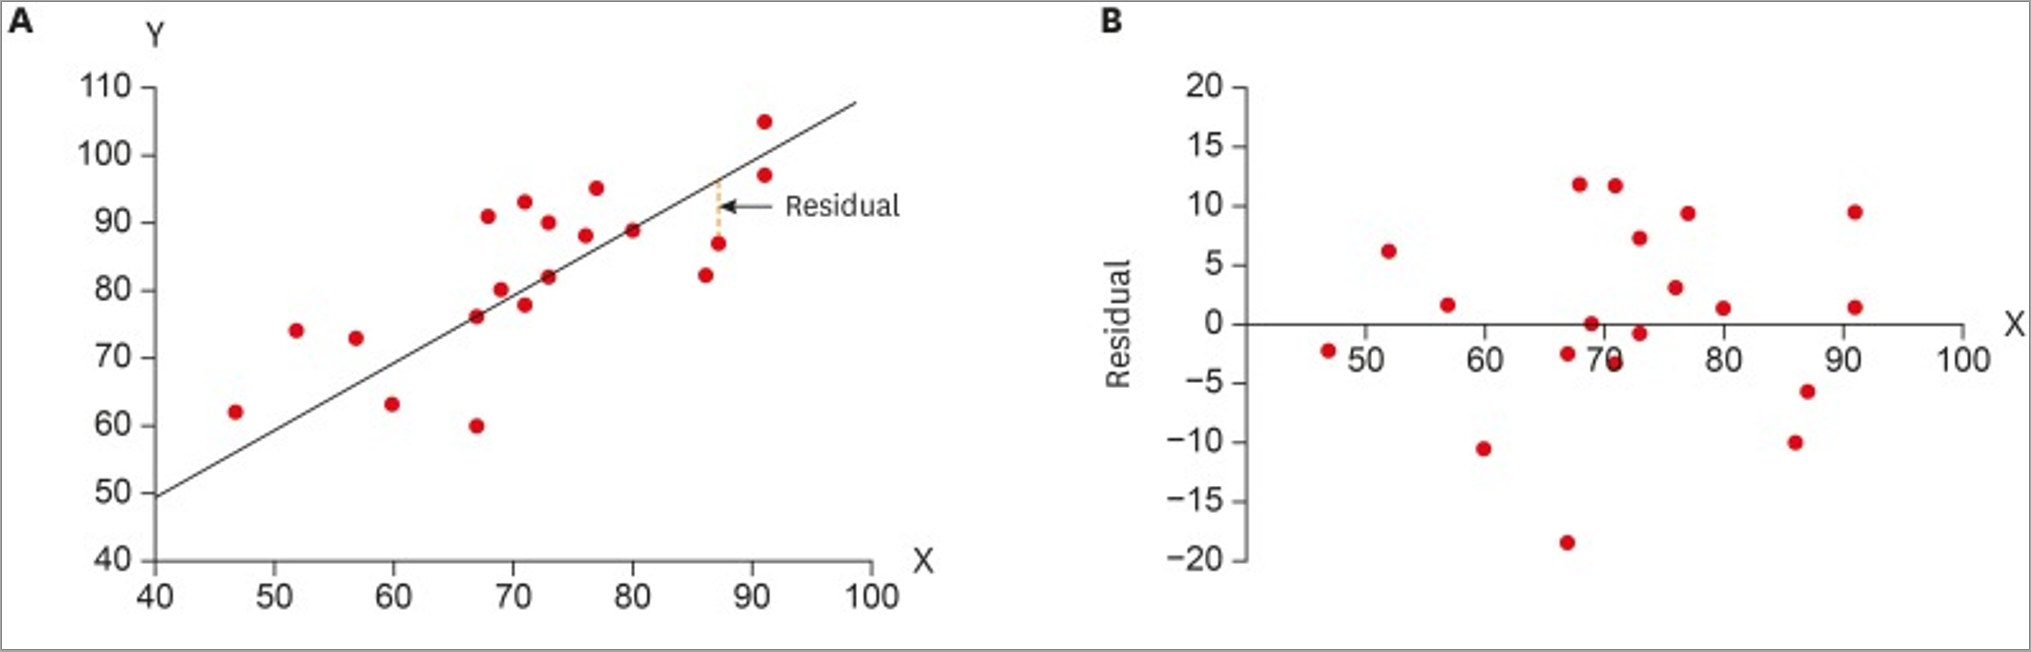
This figure shows observed data with a fitted regression line (left) alongside the residual plot for the same data (right). The residual plot displays residuals against the explanatory variable, allowing students to see whether the residuals are randomly scattered or display a pattern. The labels A and B reflect the source’s broader discussion but remain consistent with AP Statistics expectations for interpreting residual plots. Source.
Independence: Data should arise from random sampling or random assignment; for samples without replacement, the 10% condition should hold.
Constant variability: The spread of residuals should remain roughly the same across all x-values.
Normality of residuals: Especially important for smaller sample sizes; with larger samples, the t-procedures are more robust.
These requirements help confirm the validity of using the t-distribution when making inferences about slopes.
Selecting Between Inference Procedures
Choosing the most appropriate inference procedure involves determining which statistical question is being asked. Students must practice distinguishing between situations that call for estimation and those that call for hypothesis testing.
Use a confidence interval for the slope when the research question asks for a range of plausible values for the population slope.
Use a t-test for the slope when the research question asks whether data provide evidence for a particular claim about the population slope, such as testing whether β = 0.
Because both techniques rely on the standard error of the slope, understanding this quantity is essential.
EQUATION
= Standard error of the slope estimate
= Standard deviation of residuals
= Observed explanatory values
= Mean of explanatory values
A single sentence must appear here before any further definition or equation blocks can occur, ensuring clarity between conceptual and symbolic explanations.
Integrating Research Questions with Statistical Reasoning
Students must connect the context of a problem with the proper statistical tool. A question about whether an explanatory variable is a significant predictor requires a hypothesis test, whereas a question involving the strength or range of the relationship necessitates a confidence interval. Additionally, the conditions for inference determine whether these procedures can be appropriately applied to the dataset at hand.
Practicing Application Through Structured Decision-Making
Students can deepen understanding by working through the following structured approach when applying inference procedures to slopes:
Clarify the objective: estimation or hypothesis testing.
Examine plots and contextual information to confirm linearity and independence.
Evaluate residual behavior to determine suitability for t-procedures.
Select the confidence interval or significance test accordingly.
Interpret results in context, linking back to the population slope and research question.
This structured practice ensures that inference is not performed mechanically but instead reflects thoughtful, evidence-based reasoning aligned with statistical principles.
FAQ
A scatterplot with a weak pattern can still justify inference if the relationship is approximately linear and the residual plot shows no curvature or systematic structure.
You should also consider whether the variability of residuals remains constant and whether the sample size is large enough to support a reliable estimate of the slope.
If these checks are satisfied, a weak slope does not prevent inference; it simply means the estimated effect may be small.
First, investigate whether the point is a data-entry mistake, a measurement error, or a valid extreme value.
If the point is legitimate, assess how strongly it influences the slope by comparing regression output with and without the outlier.
Inference is still possible if the outlier does not distort linearity or variance patterns, but if it does, consider reporting results both ways with justification.
A larger sample size improves the precision of the slope estimate and makes the t-procedures more robust to minor departures from normality.
Small samples demand stricter scrutiny of residual plots, because skewness or heteroscedasticity can substantially affect the validity of the inference procedure.
Larger samples also reduce the impact of individual unusual points, making decisions about model suitability more stable.
Clarify whether the goal is to estimate a slope or test a claim about it. Look for keywords such as estimate, range, evidence, or significance.
If unclear, determine which decision directly addresses the research objective.
• Estimation questions call for a confidence interval.
• Questions about evidence or relationships call for a significance test.
In academic settings, explicitly linking the choice to the phrasing of the research question strengthens justification.
Try dividing the x-values into groups and comparing the spread of residuals across those groups.
Alternatively, standardised residuals can help highlight whether variability increases or decreases systematically across x.
If uncertainty remains, consider whether a transformation might stabilise variance; however, transformed models require separate justification and may change how you interpret the slope.
Practice Questions
Question 1 (1–3 marks)
A researcher collects data on the number of hours students revise (x) and their test scores (y). Before conducting inference on the slope of the regression line, the researcher produces a residual plot that shows a random scatter of points with no clear pattern.
Explain why this residual plot supports the use of a linear regression inference procedure for the slope.
Question 1 (1–3 marks)
• 1 mark: States that the residual plot shows no pattern or systematic structure.
• 1 mark: Explains that this indicates the linear model is appropriate.
• 1 mark: Connects this appropriateness to the justification for using inference on the slope (e.g., conditions for inference appear satisfied).
Maximum: 3 marks.
Question 2 (4–6 marks)
A biologist studies whether the length of daylight (x, in hours) can predict the rate of plant growth (y, in millimetres per day). After collecting a random sample of 40 observations, the biologist verifies that the relationship appears linear and that the residuals display constant variability.
(a) State whether a confidence interval or a significance test should be used if the research question is: “Does daylight length provide evidence of a non-zero association with plant growth rate?”
(b) Identify the conditions that must be checked before applying the chosen inference procedure.
(c) Explain how the validity of these conditions affects the interpretation of the slope in context.
Question 2 (4–6 marks)
(a)
• 1 mark: States that a significance test for the slope is appropriate because the question asks for evidence of a non-zero association.
(b)
Up to 3 marks total for correct identification of conditions:
• 1 mark: Linearity of the relationship between x and y.
• 1 mark: Independence of observations, including mention of random sampling or assignment.
• 1 mark: Constant variability (homoscedasticity) and approximate normality of residuals, particularly important for smaller samples.
(c)
Up to 2 marks:
• 1 mark: Explains that meeting conditions ensures the t-distribution-based inference for the slope is valid.
• 1 mark: Provides contextual interpretation, stating that if conditions are violated, conclusions about whether daylight length predicts plant growth may be unreliable.
Maximum: 6 marks.
