Questions
Question 1
Write as a decimal, correct to 3 significant figures.
Simplify . Give your answer as a single power of 5.
Solve for . Give your answer to 3 significant figures.
A quantity is quoted as to 2 decimal places. State the lower and upper bounds for .
Question 2
A quadratic model is with vertex at and passing through .
Write in the form .
Find , and .
Using your GDC, estimate the -intercepts to 3 significant figures.
Question 3
The image shows the graph of on with vertical ordinates at
. The shaded region is the area under the curve.
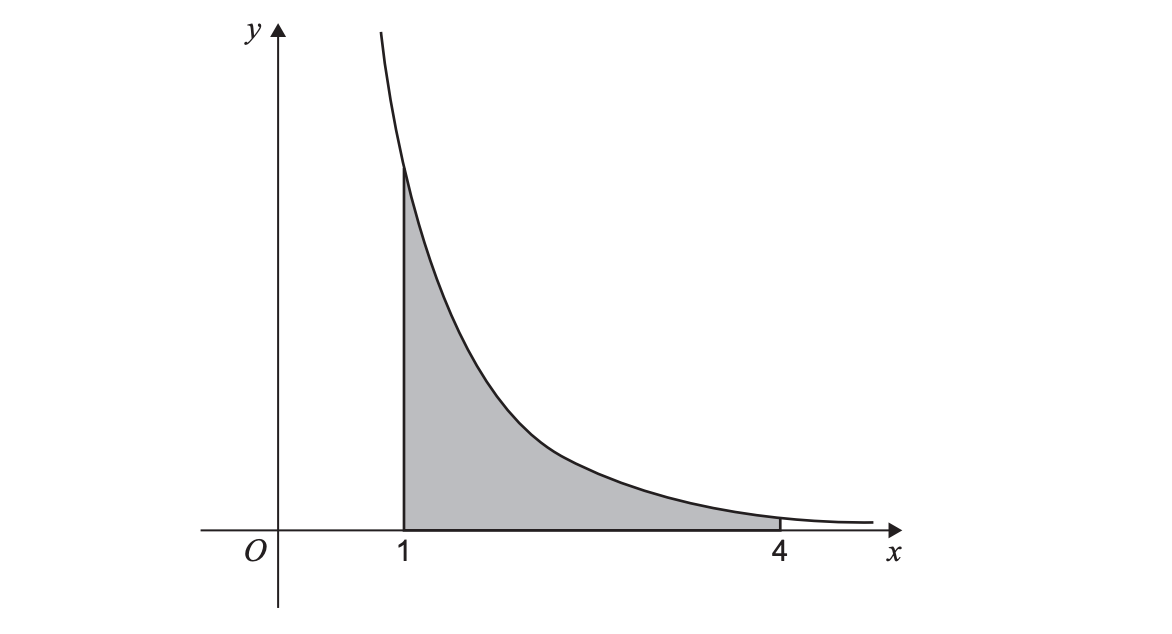
The table gives -values at the six ordinates:
: 1, 1.6, 2.2, 2.8, 3.4, 4
: 2.90988, 1.26485, 0.62305, 0.32374, 0.17263, 0.09329
State the strip width .
Use the trapezium rule to estimate the area . Give your answer to 3 significant figures.
From the shape of the graph, state whether this estimate is an overestimate or an underestimate and justify your answer.
Question 4
A tank contains 1200 mL of solution. Each month its volume increases by 3%.
Write a geometric model for the volume (mL) after months.
Find the volume after 24 months.
A second tank starts at 850 mL and increases by per month. After 24 months it reaches the same volume as in part (b). Find to 2 decimal places.
Question 5
For events and , , , .
Find .
Find .
Find .
Are and independent? Justify your answer.
Question 6
Let .
Find .
Find the 90th percentile of .
A random sample of 25 values of has mean . Find .
Question 7
A culture’s mass (mg) is modelled by , where is time in hours. Data: at ; at .
Find and .
Use your model to predict when .
State one limitation of using this model for much larger .
Question 8
The image shows sector OAB of a circle with centre O, radius , and central angle radians. Point M is the midpoint of OA.
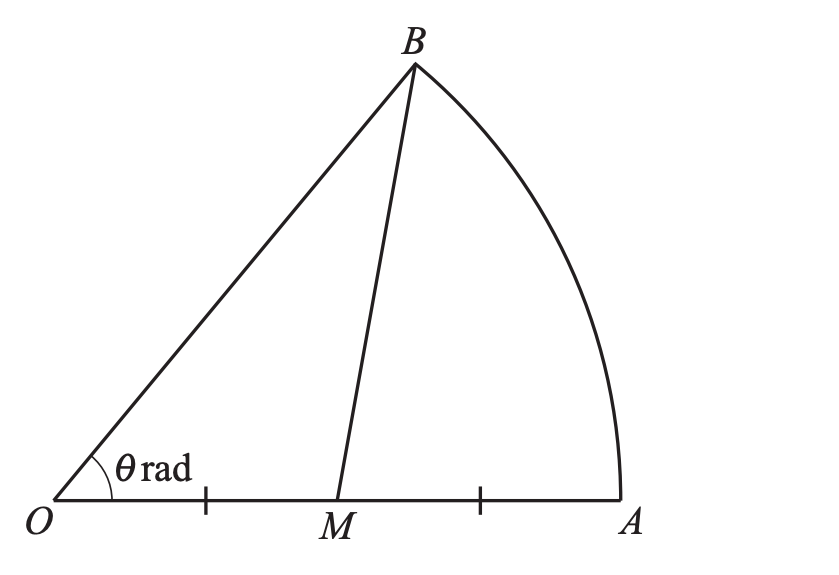
Find the arc length in terms of and .
Show that the area of sector OAB is .
Show that the area of triangle OAB is .
Hence, for and , find the area of the segment cut off by chord .
Question 9
The image is a scatter diagram of : percentage using public transport and : percentage using motorised private transport for UK local authorities. Two unusual points are labelled A (low , low ) and B (moderate , very low ).
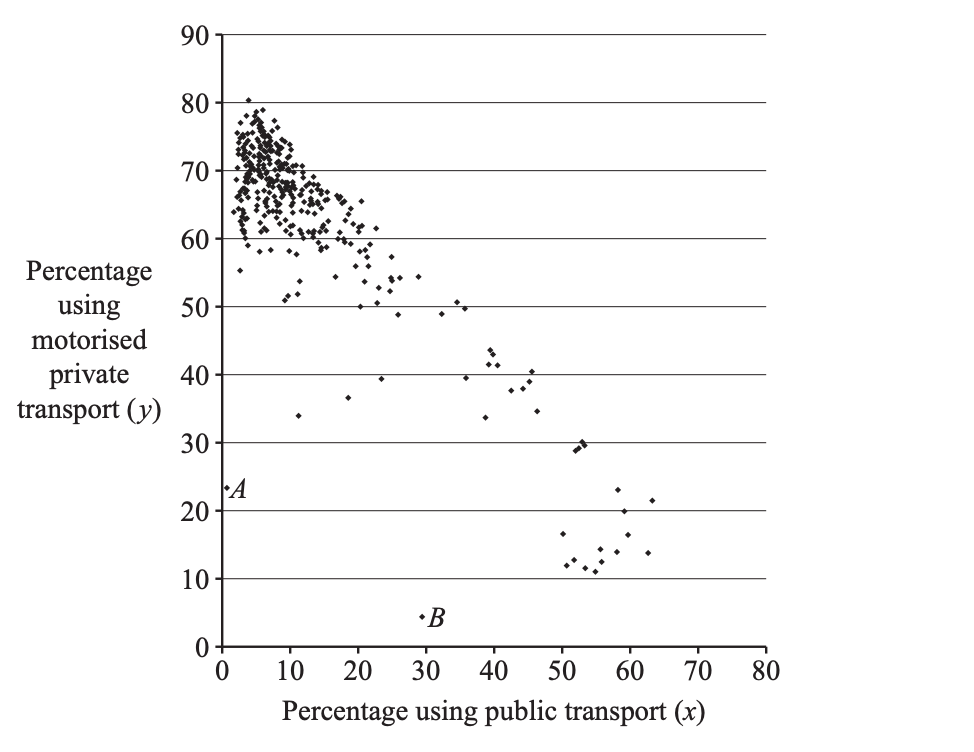
Describe the direction and strength of the association between and .
Which point, A or B, is more likely to have high leverage on a regression line of on ? Explain.
By eye, sketch a line of best fit on your answer paper and write a plausible equation .
Using your line, estimate when . Comment on the reliability of this prediction.
Question 10
Let .
Find .
Find the -coordinates of the stationary points and classify each as a local maximum or a local minimum.
Find the equation of the tangent to at .
Question 11
Consider on .
Compute .
Find the total (geometric) area between the curve and the -axis on .
Question 12
A survey recorded preference among three options (A, B, C) by gender.
Observed frequencies:
A B C | Row total
Male 30 25 15 | 70
Female 20 35 25 | 80
Col total 50 60 40 | 150
We test whether preference is independent of gender at the 5% level.
Compute the expected frequencies.
Calculate the test statistic .
State the degrees of freedom and conclude the test at . (Critical value for is 5.991.)