Questions
Question 1
A car dealership recorded sale prices of cars over one year. The histogram shows frequency density against price. It is known that 66 cars were sold in the price range to .
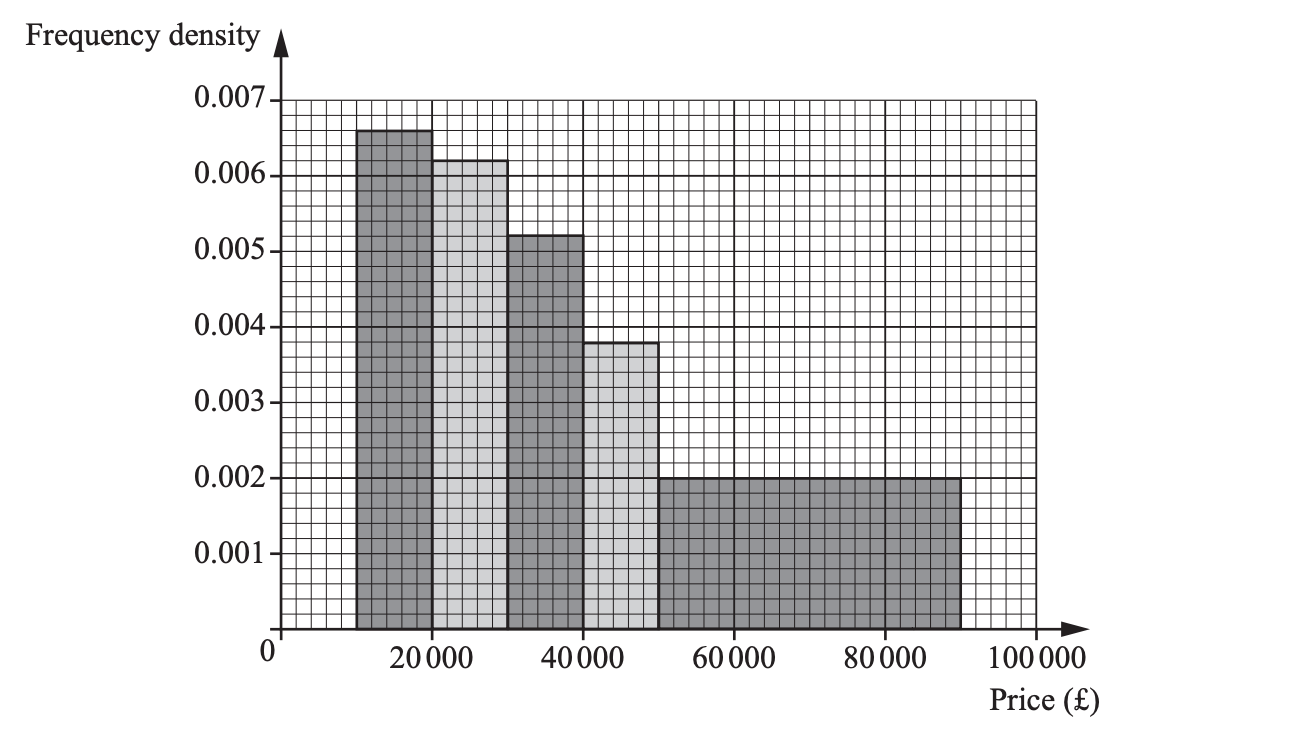
The frequency density for a class is defined as
Show that the frequency density for the – class is .
By reading the histogram, write down the frequency density for the – class.
Hence estimate the number of cars sold in the – class.
Using the axes and scale from the histogram, estimate the frequency in each class and the total number of cars sold. Show your working; you may present your results in a short table.
Using class midpoints together with your class frequencies from part (d), use your GDC to estimate the mean sale price (to the nearest ).
Comment on the skewness of the distribution, giving a reason from the histogram.
Question 2
The graph below shows the probability density function on . The curve is a quarter of a circle with centre at the origin and radius .
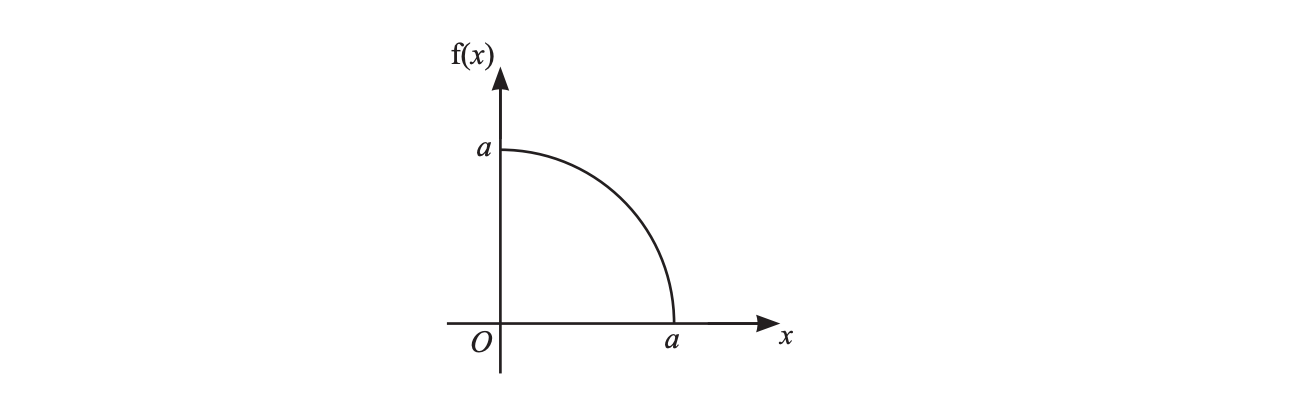
Write a formula for on and for outside this interval.
Using the fact that the total area under a probability density function is , find . (You may use the area of a quarter circle.)
Use your GDC to evaluate . Give your answer to significant figures. (Exact working with a correct value of earns full credit.)
Find . You may use technology to compute . Give an exact simplified form and a decimal value.
State the mode of this distribution and explain briefly whether the median is less than, equal to, or greater than the mean.
Question 3
Triangle has , and angle .
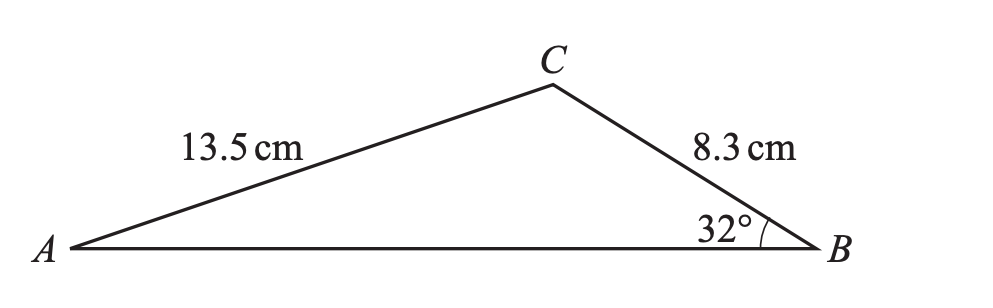
Find , giving your answer to significant figures.
Find the area of triangle .
Determine angle and the perpendicular height from to the line segment .
If is increased by while angle and remain unchanged, find the new length of (to significant figures). Comment briefly on the effect on .
Question 4
Over a year the four children , , and attended some of parties. The Venn diagram shows, for each region, how many parties were attended by exactly those children. (All regions outside the circles sum to — every party was attended by at least one child.)
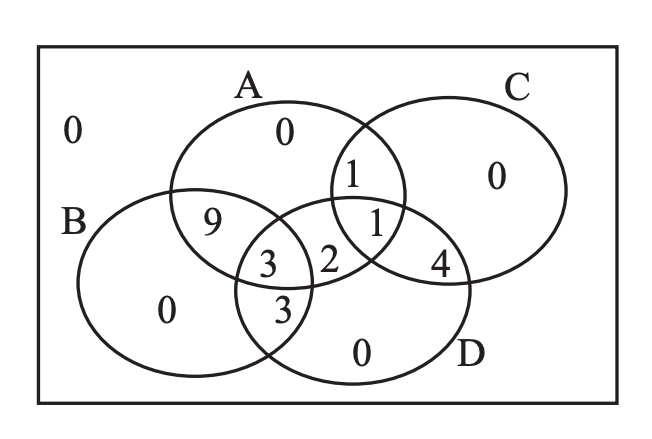
Write down and the number of parties attended by no child.
Find , , and .
Compute the following probabilities as simplified fractions:
(i) (ii) (iii) (iv) .
Find the probability that a randomly chosen party was attended by exactly one child. Then find the probability that at least three children attended.
Compute and . Which child is more likely to attend given that the other attends? Justify your answer.
Are and independent? Justify using and .
Question 5
A laboratory purchases equipment costing . The debt will be repaid by equal monthly payments. Interest is charged monthly at a flat rate of on the outstanding balance at month-end.
Let () be the debt immediately after the -th payment (). If the monthly payment is (), write a recurrence for in terms of , and the monthly interest rate .
Use your GDC (TVM/recurrence) to find the monthly payment that clears the debt in months. Give to the nearest pound.
A maintenance fund invests at the end of each month at a monthly rate of . Using the geometric-series formula, find the fund value after months.
Using your answers to parts (b) and (c), decide whether the fund can cover the last two repayments in full at month (after deposits). Justify numerically.
Sensitivity analysis. If the loan rate rises to per month, estimate the new monthly payment and the percentage increase from part (b).
Show algebraically that the level-payment formula is
for principal , monthly rate , and payments. Outline the geometric-series steps clearly.