

Question 1
A monatomic ideal gas is sealed below the frictionless piston shown in the diagram. The piston has cross-sectional area and negligible mass. A block of mass rests on the piston, and the region above the piston is a vacuum. The latches are released after the gas pressure has been adjusted so that the piston remains in equilibrium. Energy is then transferred to the gas slowly, causing the piston and block to rise through the marked distance at constant speed.
Use the sign convention , where is the work done on the gas.
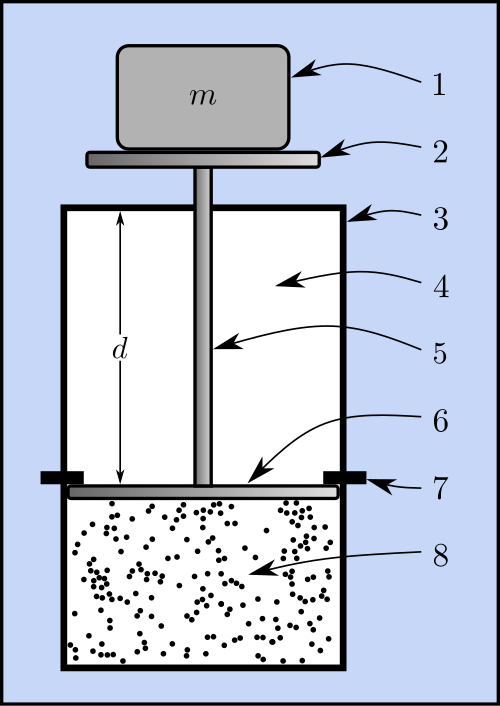
Draw a free-body diagram of the combined piston-block system while it rises at constant speed. Label all forces and their directions.
Derive an expression for the work done on the gas while the piston rises through distance . Express the result in terms of , , and .
Derive an expression for the energy transferred to the gas during the rise. Express the result in terms of , , and .
Calculate when , , and .
A second trial is performed with a block of mass . The piston rises through the same distance , and all other relevant properties are unchanged.
Determine the factor by which the energy transferred to the gas changes.
Justify the answer using the functional dependence obtained in part (c).
Question 2
The image below shows a thermally insulated cylinder containing a fixed amount of monatomic ideal gas beneath a movable piston. Sand is removed from the piston one grain at a time, so the gas expands slowly through a sequence of equilibrium states. The cylinder is open to atmospheric pressure above the piston.
The gas moves from state , described by , , and , to state , described by , , and , where . No energy is transferred through thermal processes.
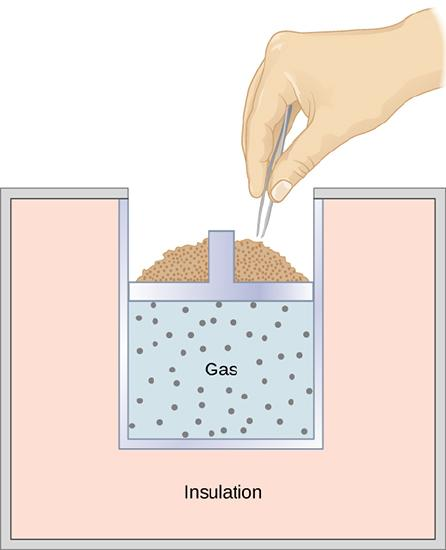
Draw a free-body diagram of the piston and remaining sand at an intermediate point in the expansion. Label the force exerted by the gas, the force due to atmospheric pressure, and the gravitational force on the piston-sand system.
Derive an expression for the ratio in terms of , , , and .
Determine whether is greater than, less than, or equal to .
Justify the answer using the first law of thermodynamics and the relationship between the internal energy and temperature of a monatomic ideal gas.
Sketch a graph of pressure as a function of volume for the expansion from state to state . Label both states. On the same axes, sketch the path for an isothermal expansion that begins at state and ends at volume . Clearly indicate the relative positions of the two paths.
A separate cylinder begins at the same state but is placed in thermal contact with a large reservoir at temperature . Sand is removed until the gas reaches volume .
Compare the final pressure in this isothermal process with .
Justify the comparison using the graph and an appropriate mathematical relationship.
Question 3
The diagram below represents gas particles confined beneath a movable piston that is acted on by an external force. A student models this arrangement with an airtight syringe connected to an absolute-pressure sensor. The syringe contains a fixed amount of gas.
The student wants to investigate how the absolute pressure of the gas depends on its volume when its temperature is held constant.

Describe a procedure that the student could use to obtain sufficient data to determine how absolute pressure depends on gas volume. Include appropriate equipment, the measurements to be made, and steps that improve the reliability of the investigation.
Indicate the independent variable, the dependent variable, and two quantities that should be held constant.
A different group performs a similar investigation at a temperature of and records the following measurements.
Trial 1: volume ; absolute pressure .
Trial 2: volume ; absolute pressure .
Trial 3: volume ; absolute pressure .
Trial 4: volume ; absolute pressure .
Trial 5: volume ; absolute pressure .
Trial 6: volume ; absolute pressure .
Use and
.
Calculate the reciprocal volume for each trial.
Plot absolute pressure on the vertical axis as a function of reciprocal volume on the horizontal axis. Label both axes with units, use sensible linear scales, plot all six points, and draw a best-fit line.
Determine the slope of the best-fit line, including units.
Calculate the number of moles of gas trapped in the syringe.
Question 4
The image below shows a rigid, thermally insulated container divided into two equal chambers. Initially, a monatomic ideal gas occupies the left chamber, while the right chamber is a vacuum. The membrane separating the chambers is punctured, and the gas eventually fills the entire container.
Let the initial equilibrium state be described by pressure , volume , and temperature . Let the final equilibrium state be described by , , and . The amount of gas remains constant.
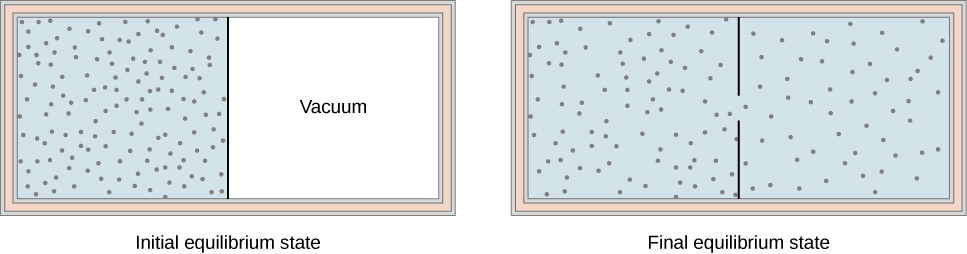
Determine whether the entropy of the gas increases, decreases, or remains constant after the membrane is punctured.
Justify the answer without using equations. Base the reasoning on the distribution of the gas particles and the tendency of an isolated system to approach equilibrium.
Derive expressions for and in terms of the initial quantities. Use the first law of thermodynamics, the internal-energy relationship for a monatomic ideal gas, and the ideal gas law.
Verify that the mathematical results from part (c) are consistent with the entropy conclusion from parts (a) and (b). Refer to both the particle distribution shown and the physical meanings of temperature and pressure.
Question 5
A fixed amount of a monatomic ideal gas undergoes the clockwise cycle shown in the graph below. The pressure scale is in multiples of , and the volume scale is in multiples of . Use , where is work done on the gas. For a monatomic ideal gas, the internal energy is determined by the average kinetic energy of its atoms.
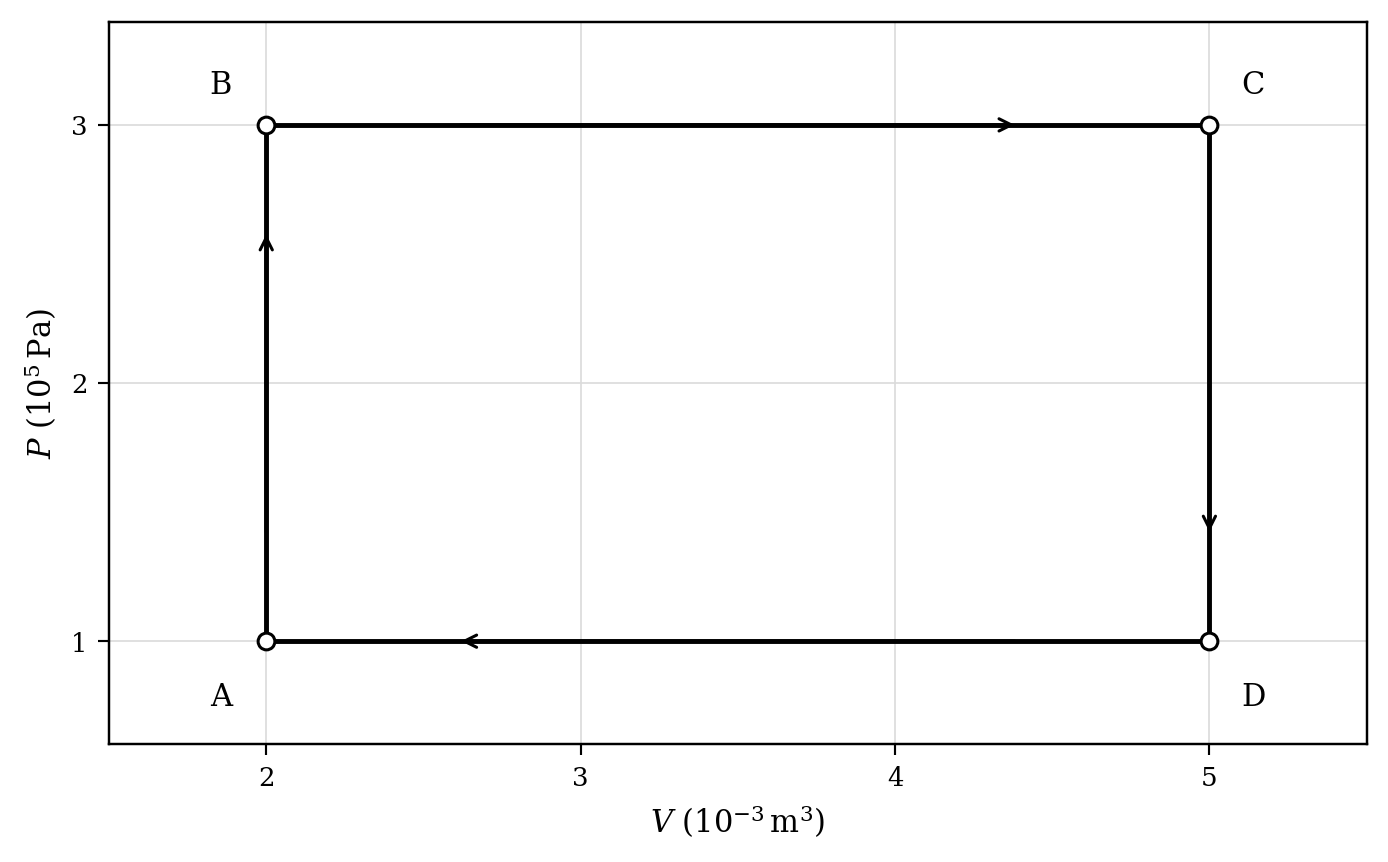
Determine whether the net work done on the gas during one complete cycle is positive or negative.
Calculate the net work done on the gas during one complete cycle.
Derive an expression for the change in internal energy from state to state in terms of the pressures and volumes at the two states. Begin with the ideal-gas law and the kinetic-energy model for a monatomic ideal gas.
Calculate the energy transferred to the gas by heating during process .
Sketch a graph of internal energy as a function of volume during process . Label the values of at states and .
Justify the sign and magnitude of the net energy transferred to the gas by heating during the complete cycle.
Question 6
Samples and contain equal numbers of moles of the same ideal gas in separate sealed rigid containers. The graph below shows the pressure of each sample as its absolute temperature changes. At , the pressures are and .
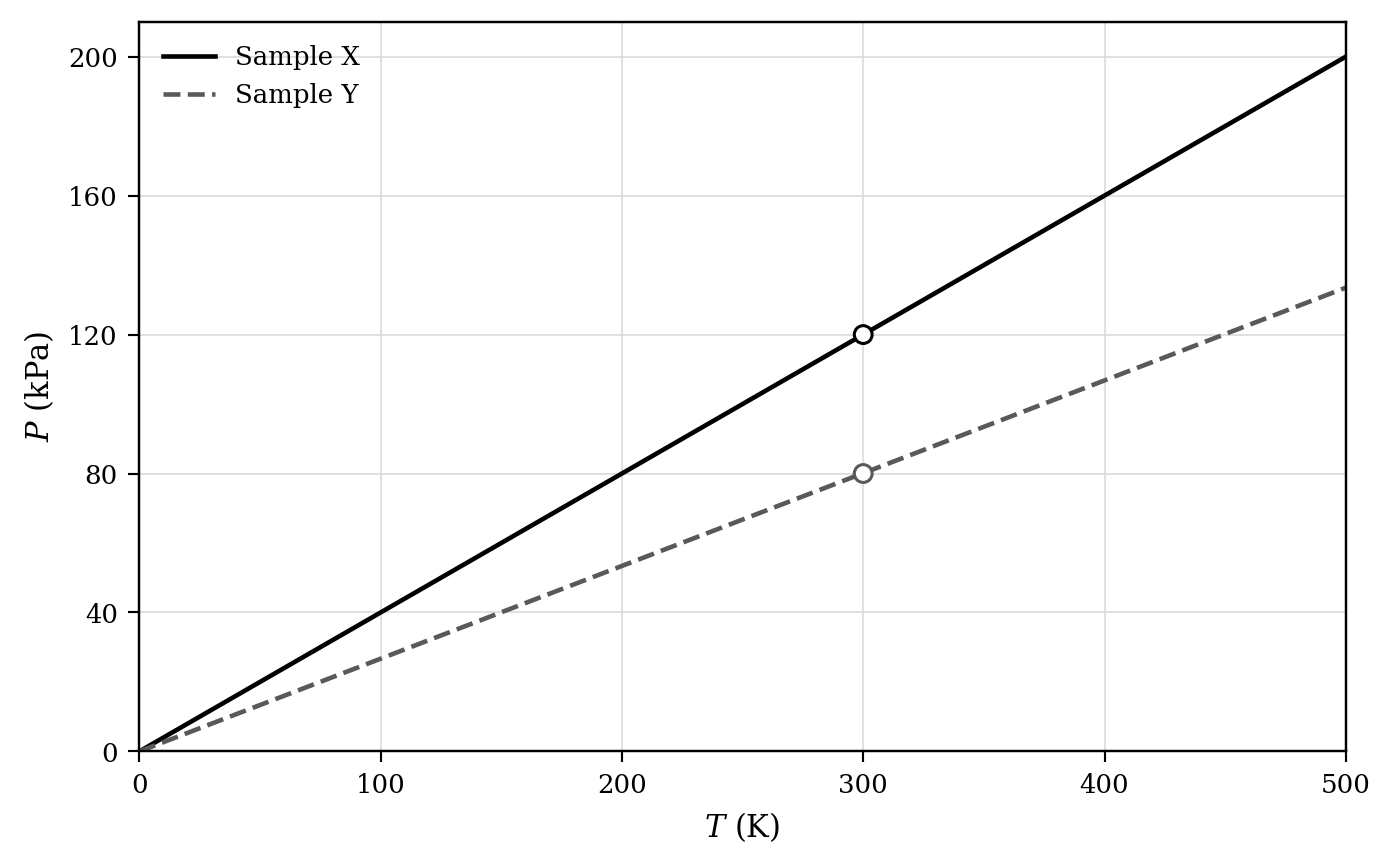
Determine which sample occupies the larger volume.
Justify your answer using the graph and the ideal-gas model.
Draw particle diagrams for samples and at . Show the same number of particles in each diagram and represent the relative container volumes.
Derive an expression for the slope of a pressure-versus-temperature graph for a sealed rigid sample in terms of , , and .
Calculate the ratio using the slopes or the graph values at .
Sketch a graph of as a function of for sample when it is allowed to expand at constant pressure from to . Label the initial point and the final volume in terms of .
Determine the factor by which the root-mean-square speed changes when sample is heated from to .
Justify why the pressure can remain constant during this heating process even though the atoms move faster.
Question 7
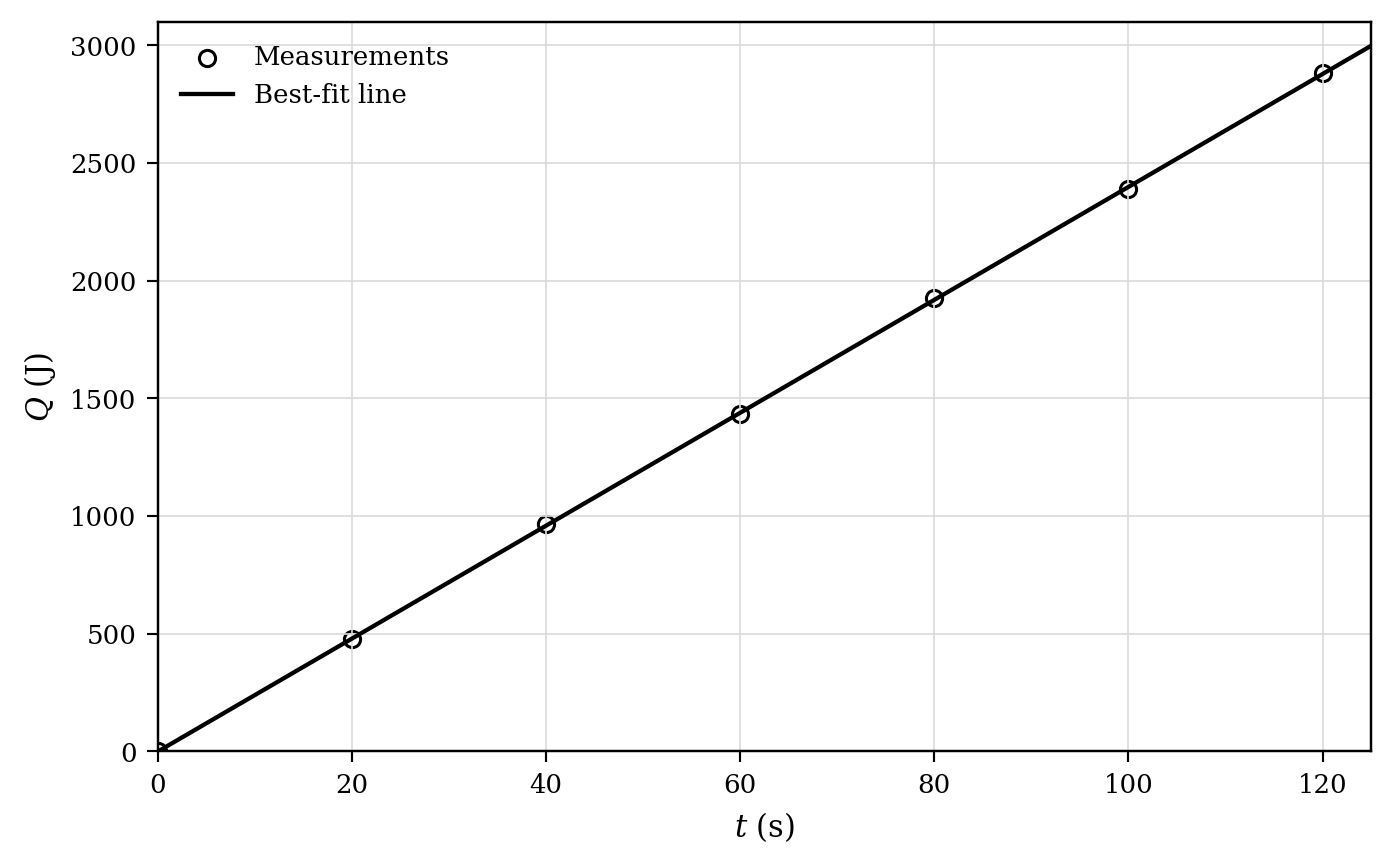
A student calibrates an immersion heater by measuring the thermal energy delivered to a well-insulated system during different heating times . The calibration data and best-fit line are shown below. The student then investigates the specific heat of a solid sample. Assume energy losses are small over the measurement interval.
Design investigation: The student wants to investigate how the temperature change of samples made from the same material depends on sample mass when each sample receives the same amount of energy.
Describe a feasible procedure, including the equipment and the measurements needed to vary sample mass and measure temperature change.
Describe two important variables that should be controlled and how repeated trials should be used.
Describe a graphical analysis that would test the expected dependence of temperature change on mass.
Analysis investigation: A different student uses one sample of mass and varies the heating time. The measured observations are listed below.
Trial 1: ; .
Trial 2: ; .
Trial 3: ; .
Trial 4: ; .
Trial 5: ; .
Trial 6: ; .
Determine the heater power from the slope of the calibration graph.
Calculate the energy delivered in each trial using the calibration relationship.
Plot as a function of for the six trials. Label both axes with units, use a sensible scale, and draw a best-fit line.
Calculate the specific heat of the sample from the slope of the graph in part (d).
Justify whether the plotted data are consistent with a temperature-independent specific heat over the measured range.
Question 8
Objects and are placed in thermal contact inside an insulated enclosure. Their temperatures are recorded as functions of time, as shown below. Object has mass and specific heat . Object has mass and unknown specific heat .
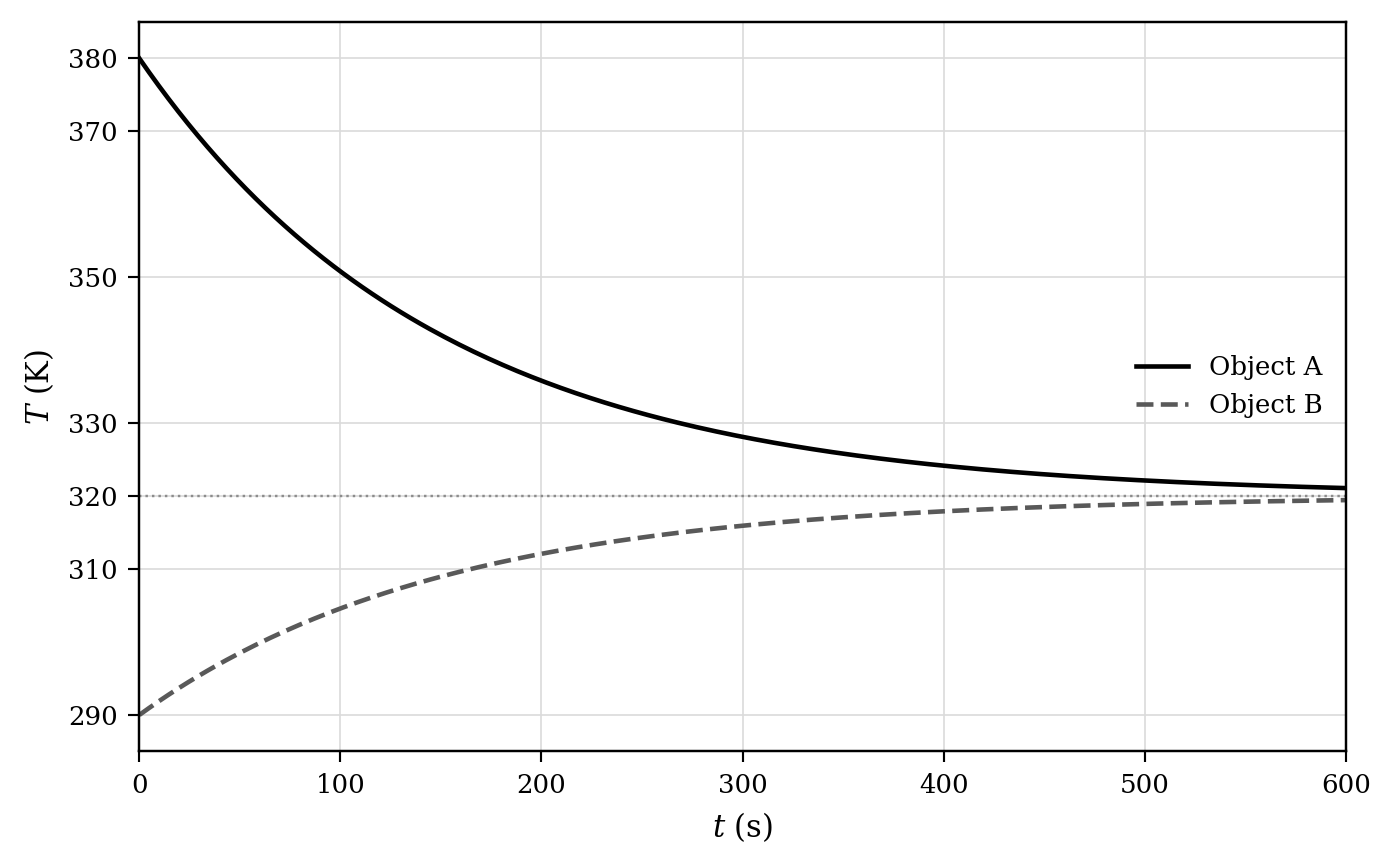
Determine the direction of net energy transfer by thermal processes immediately after the objects are placed in contact. Do not use equations.
Justify your answer using the graph and a microscopic description of thermal energy transfer. Do not use equations.
Determine how the total entropy of the isolated two-object system changes before equilibrium is reached.
Justify your answer using the second law and the distribution of energy. Do not use equations.
Derive an expression for in terms of , , , the two initial temperatures, and the equilibrium temperature.
Calculate using the values obtained from the graph.
Determine the new equilibrium temperature if the mass of object is doubled while all initial temperatures and specific heats remain unchanged.
Question 9
Two slabs made from materials and have the same cross-sectional area and thickness . A steady temperature difference is maintained across each slab. The graph below shows the measured rate of energy transfer by conduction, .
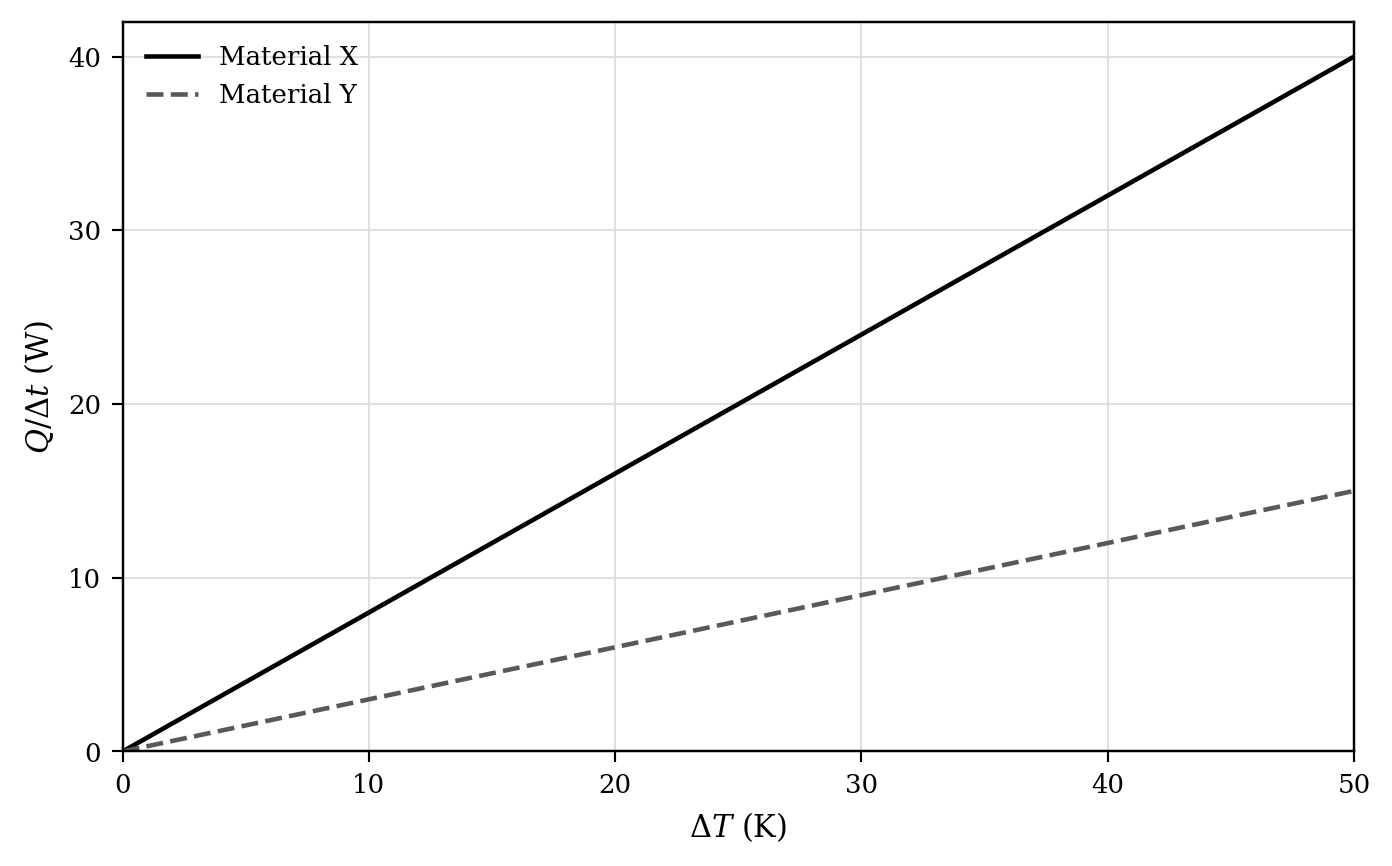
Compare the rates of energy transfer through the two materials for the same nonzero temperature difference.
Derive an expression for the slope of the graph in terms of thermal conductivity , area , and thickness .
Calculate the thermal conductivity .
Calculate the thermal conductivity .
Calculate the energy transferred through material in when .
Determine the factor by which the conduction rate through material changes if its area is halved and its thickness is doubled while is unchanged.
Justify the factor in part (e)(i) using functional dependence.
Verify that the graph intercept is physically consistent with the conduction model.
Question 10
Two samples contain equal numbers of the same type of ideal-gas atom. One sample is at and the other is at . The graph below shows the speed distributions. The area under each curve represents the same total number of atoms. For an atom of mass , , and the average kinetic energy of an ideal-gas atom is .
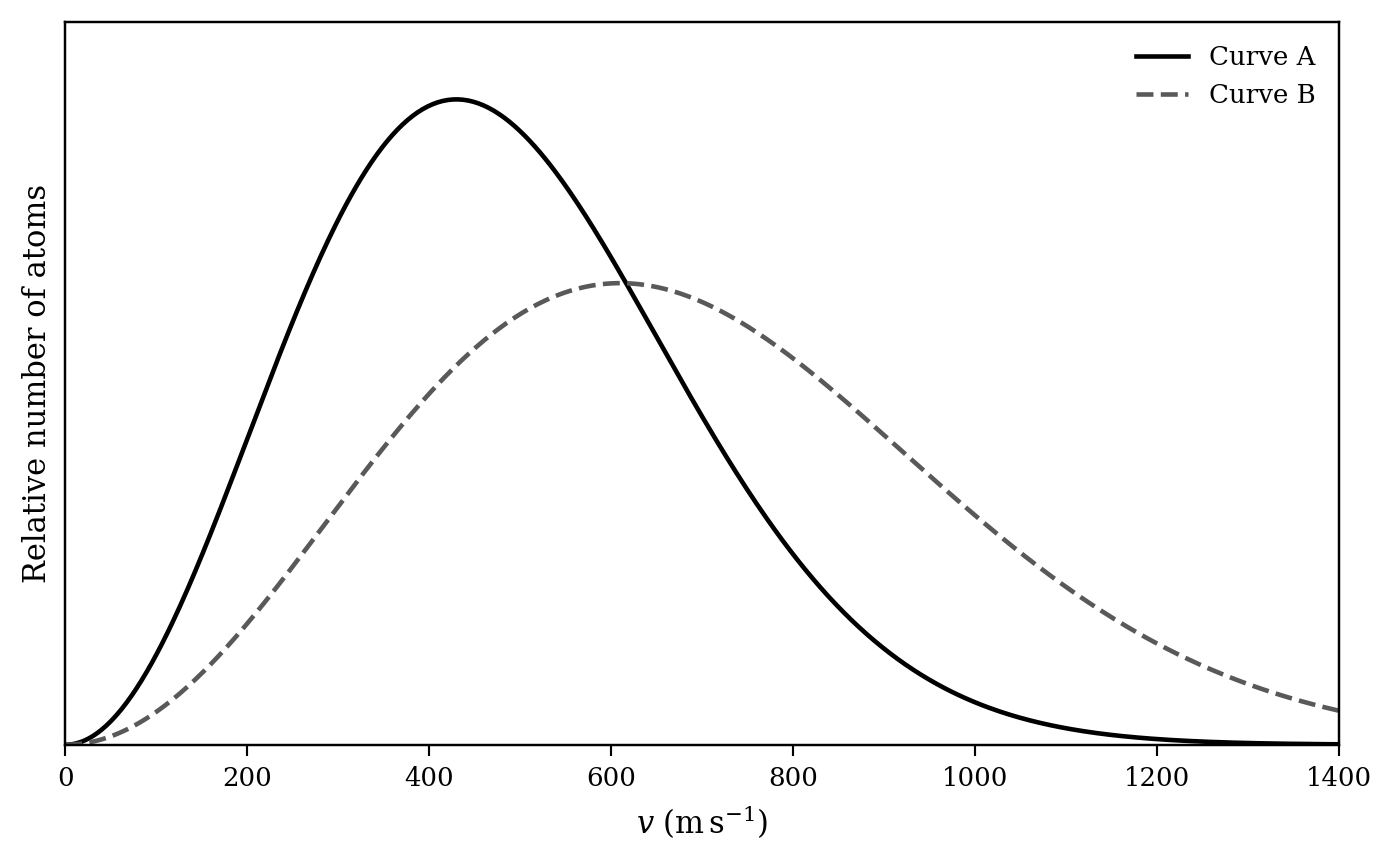
Determine which curve represents the sample at .
Justify your answer using two features of the graph.
Draw particle diagrams for the two samples in equal-volume containers. Show equal numbers of particles and use velocity arrows to represent the relative speed distributions.
Derive the relationship between root-mean-square speed and absolute temperature for atoms of mass .
Calculate the ratio of the root-mean-square speeds of the and samples.
Sketch a pressure-versus-temperature graph for either sample when the number of atoms and volume are constant. Mark the two temperatures and show the relative pressures.
Justify the pressure difference between the two states using atomic collisions with the container walls.