

Question 1
The historical drawing below shows the components of a torsion balance used to investigate electrostatic interactions. Focus on the central horizontal arm, the movable sphere attached to the arm, and the nearby fixed sphere.
In a simplified version of the apparatus, a light horizontal insulating rod is suspended at its center by a thin vertical wire. A small conducting sphere is attached a distance from the suspension axis, and an identical sphere is fixed at the same height. Each sphere carries charge . The center-to-center separation is .
At equilibrium, the rod is rotated through an angle . The suspension wire produces a restoring torque of magnitude , where is the torsion constant. Assume that the electric force on sphere is tangent to its circular path and that the spheres can be modeled as point charges.
For one trial,
,
,
,
,
and
.
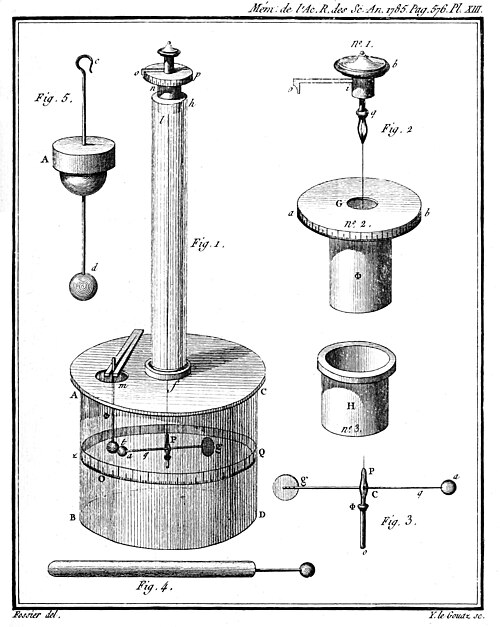
Draw a simplified top-view schematic based on the central portion of the apparatus shown. Your drawing must include the suspension axis, the horizontal arm, spheres and , the distance , the separation , the electric force on sphere , and the direction of the restoring torque.
Derive an expression for the magnitude of the charge in terms of , , , , and . Begin with the rotational-equilibrium condition and Coulomb’s law.
Calculate the charge on each sphere for the trial described.
Determine the new equilibrium angle if the separation is increased from to while all other quantities remain unchanged.
Determine whether the electric potential energy of the two-sphere system increases, decreases, or remains constant when sphere is moved quasistatically closer to sphere .
Justify your answer using an appropriate physical relationship or a work-energy argument.
Question 2
The diagram below shows the electric-field lines and equipotential lines outside an isolated positive charge.
Consider a positively charged conducting sphere of radius and charge . Outside the sphere, its field is equivalent to that of a point charge at its center. Point is located at radial distance , and point is located at radial distance along the same electric-field line.
A positive particle of charge and mass is released from rest at point and moves outward toward point . Gravitational effects are negligible, and the electric potential is defined to be zero infinitely far from the sphere.
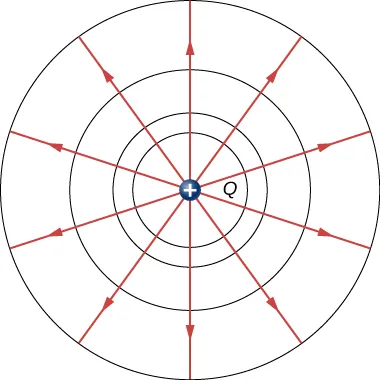
Draw energy-bar representations for the sphere-particle system when the particle is at point and when it reaches point . Include electric potential energy, kinetic energy, and total mechanical energy.
Derive an expression for the speed of the particle when it reaches point in terms of , , , , and .
Sketch a graph of electric potential as a function of radial distance for . Label the values of the potential at , , and , and show the limiting behavior at large .
Determine the ratio of the electric-field magnitude at point to that at point .
Justify why the relative spacing of the equipotential lines in the diagram is consistent with both the graph in part (c) and the ratio in part (d).
A particle with charge is instead released from rest at point . Determine the direction of its initial acceleration.
Question 3
The diagram below shows a parallel-plate capacitor. The plate area is represented by , and the separation between the plates is represented by .
Students investigate how changing the plate separation affects the capacitance of an air-filled capacitor. The plates remain parallel, their overlapping area remains constant, and edge effects are negligible.
In a separate investigation, students use plates with overlapping area
.
They collect the following measurements:
Trial 1: ; .
Trial 2: ; .
Trial 3: ; .
Trial 4: ; .
Trial 5: ; .
Trial 6: ; .
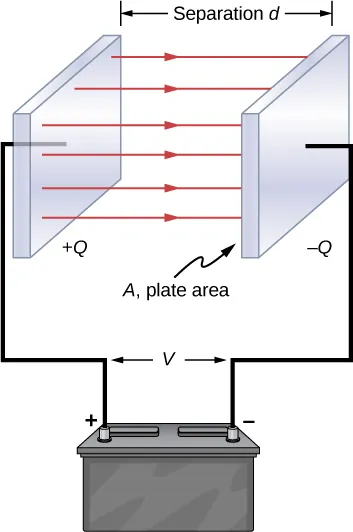
Indicate the independent variable and the dependent variable for an investigation of how plate separation affects capacitance.
Describe a repeatable experimental procedure. Include the equipment needed, how the relevant quantities would be measured, and at least two variables that should be controlled.
Describe a graphical analysis that would test the expected functional relationship between capacitance and plate separation and allow the students to determine the permittivity of free space.
Calculate the value of for Trial 3 in units of .
Plot capacitance on the vertical axis as a function of on the horizontal axis. Label both axes with units, use sensible linear scales, plot all six data points, and draw an appropriate best-fit line.
Determine the experimental value of the permittivity of free space from the slope of the best-fit line.
Question 4
The photograph below shows an oil-drop apparatus. In a simplified model of its operation, two horizontal conducting plates are separated by distance . The upper plate is maintained at a higher electric potential than the lower plate, producing an approximately uniform electric field between them.
A small oil drop of mass carries charge , where represents a positive magnitude. The potential difference is adjusted until the drop remains stationary between the plates. Ignore buoyancy and air resistance while the drop is stationary.
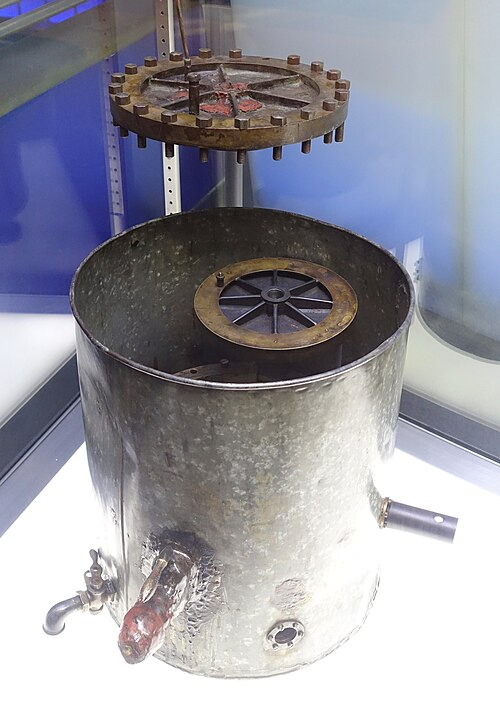
Determine the direction of the electric field between the plates that allows the negatively charged drop to remain stationary.
Justify your answer by relating the directions of the electric force, the electric field, and the gravitational force on the drop.
Derive an expression for the magnitude of the potential difference required to suspend the drop in terms of , , , and .
The suspended drop suddenly gains additional electrons so that its charge becomes , while its mass and the potential difference remain unchanged. Determine the magnitude and direction of the drop’s initial acceleration in terms of .
Question 5
A positively charged sphere with charge is fixed in place. A second positively charged sphere of unknown charge and mass is positioned to the right of the first sphere. The center-to-center separation is .
A student measures the magnitude of the electrostatic force for several separations and plots against . The dashed line is the best-fit line. Use .
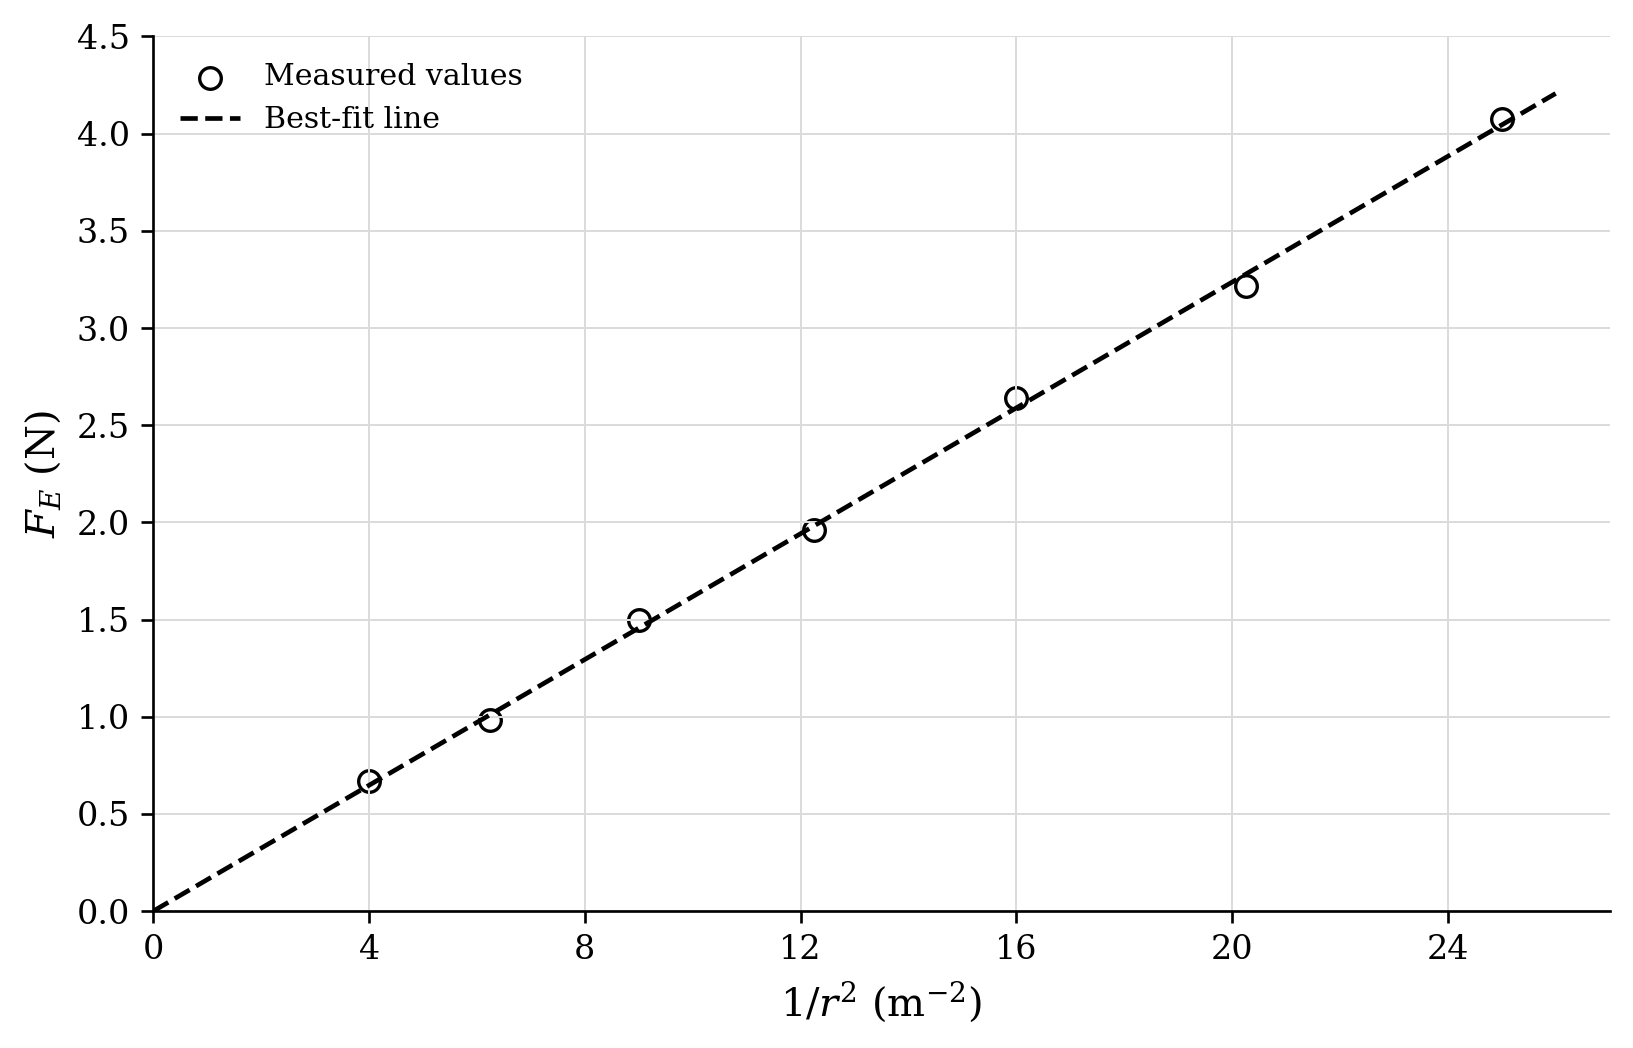
Determine the slope of the best-fit line.
Indicate the SI units of the slope.
Let represent the slope of the graph. Derive an expression for in terms of , , and .
Calculate the magnitude of .
Draw a free-body diagram for the second sphere when it is to the right of the fixed sphere and no other forces act horizontally.
Calculate the acceleration of the second sphere when .
Justify whether the plotted results are consistent with the distance dependence predicted by Coulomb’s law.
Question 6
An isolated positively charged solid conducting sphere is in electrostatic equilibrium. The graph shows electric potential as a function of radial distance from the center of the sphere. Electric potential is defined to be zero infinitely far from the sphere.
Use .
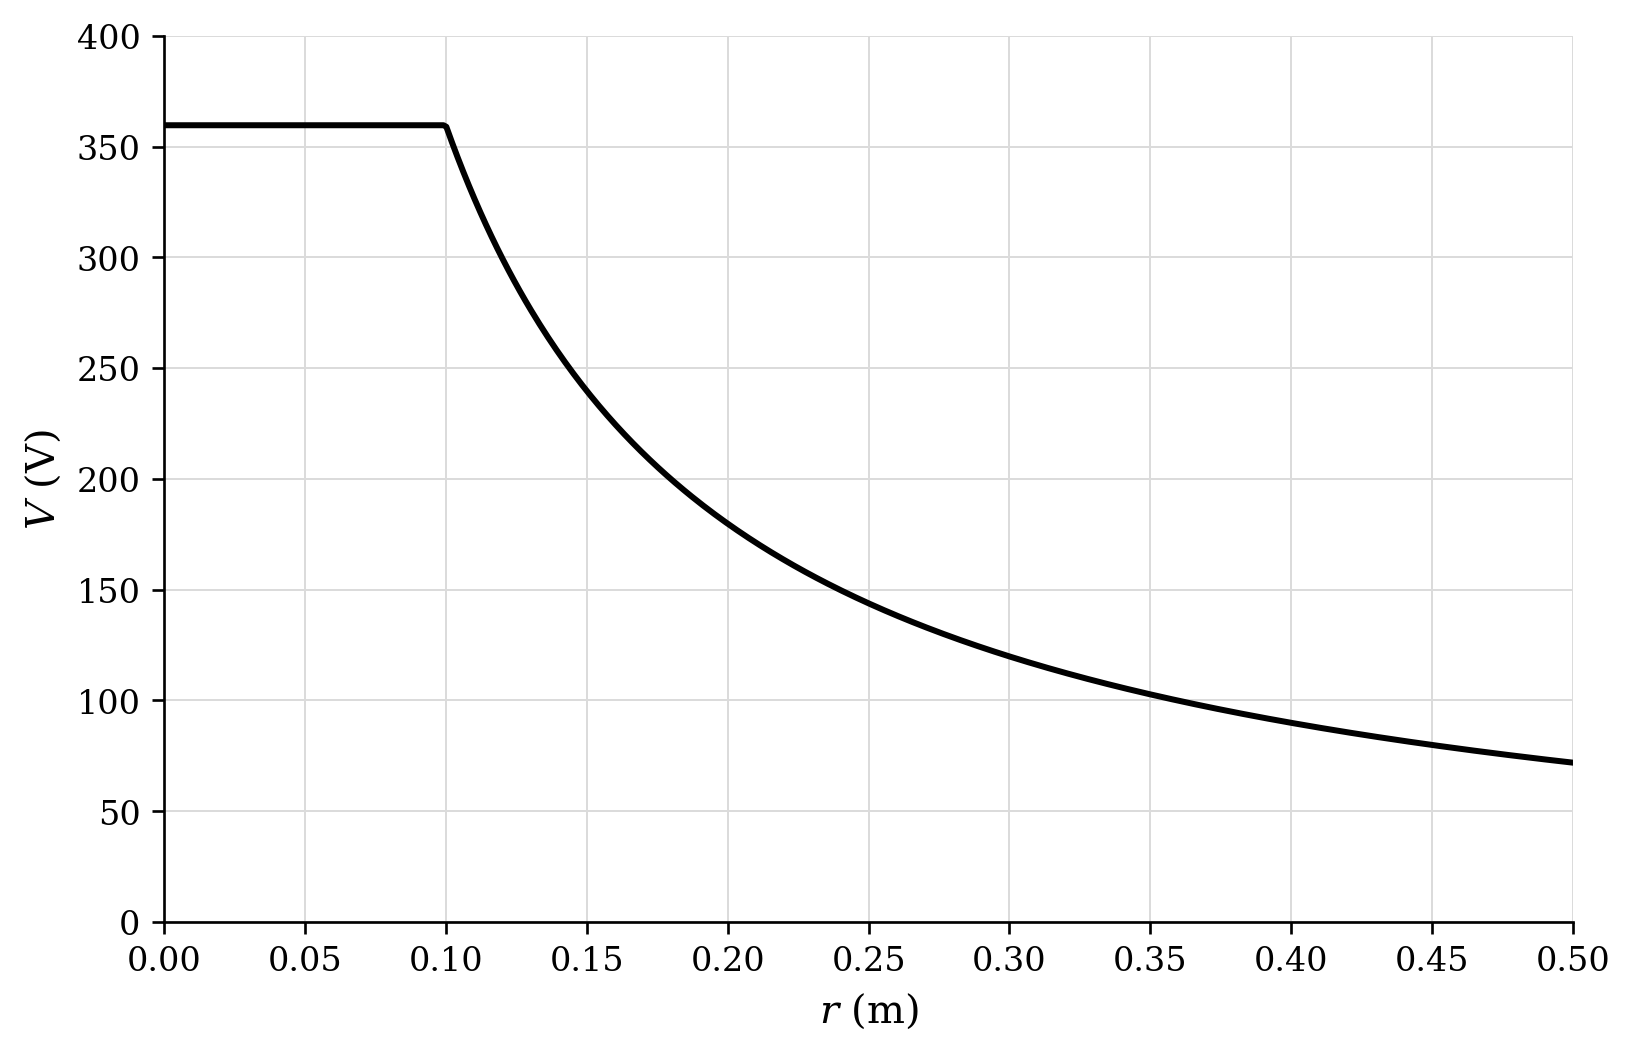
Determine the radius of the sphere and the electric potential at its surface.
Draw a cross-sectional representation of the conducting sphere that includes the distribution of excess charge and electric-field vectors inside and outside the sphere.
Let the surface potential be and the sphere radius be . Derive the relationship for the electric-field magnitude immediately outside the surface.
Calculate the electric-field magnitude immediately outside the sphere.
Sketch a graph of electric-field magnitude as a function of from to .
Justify how the electric-potential graph and the electric-field representation are consistent with each other both inside and outside the conductor.
Question 7
A student charges a parallel-plate capacitor to several potential differences and measures the magnitude of charge stored on one plate. The graph shows the measurements and a best-fit line.
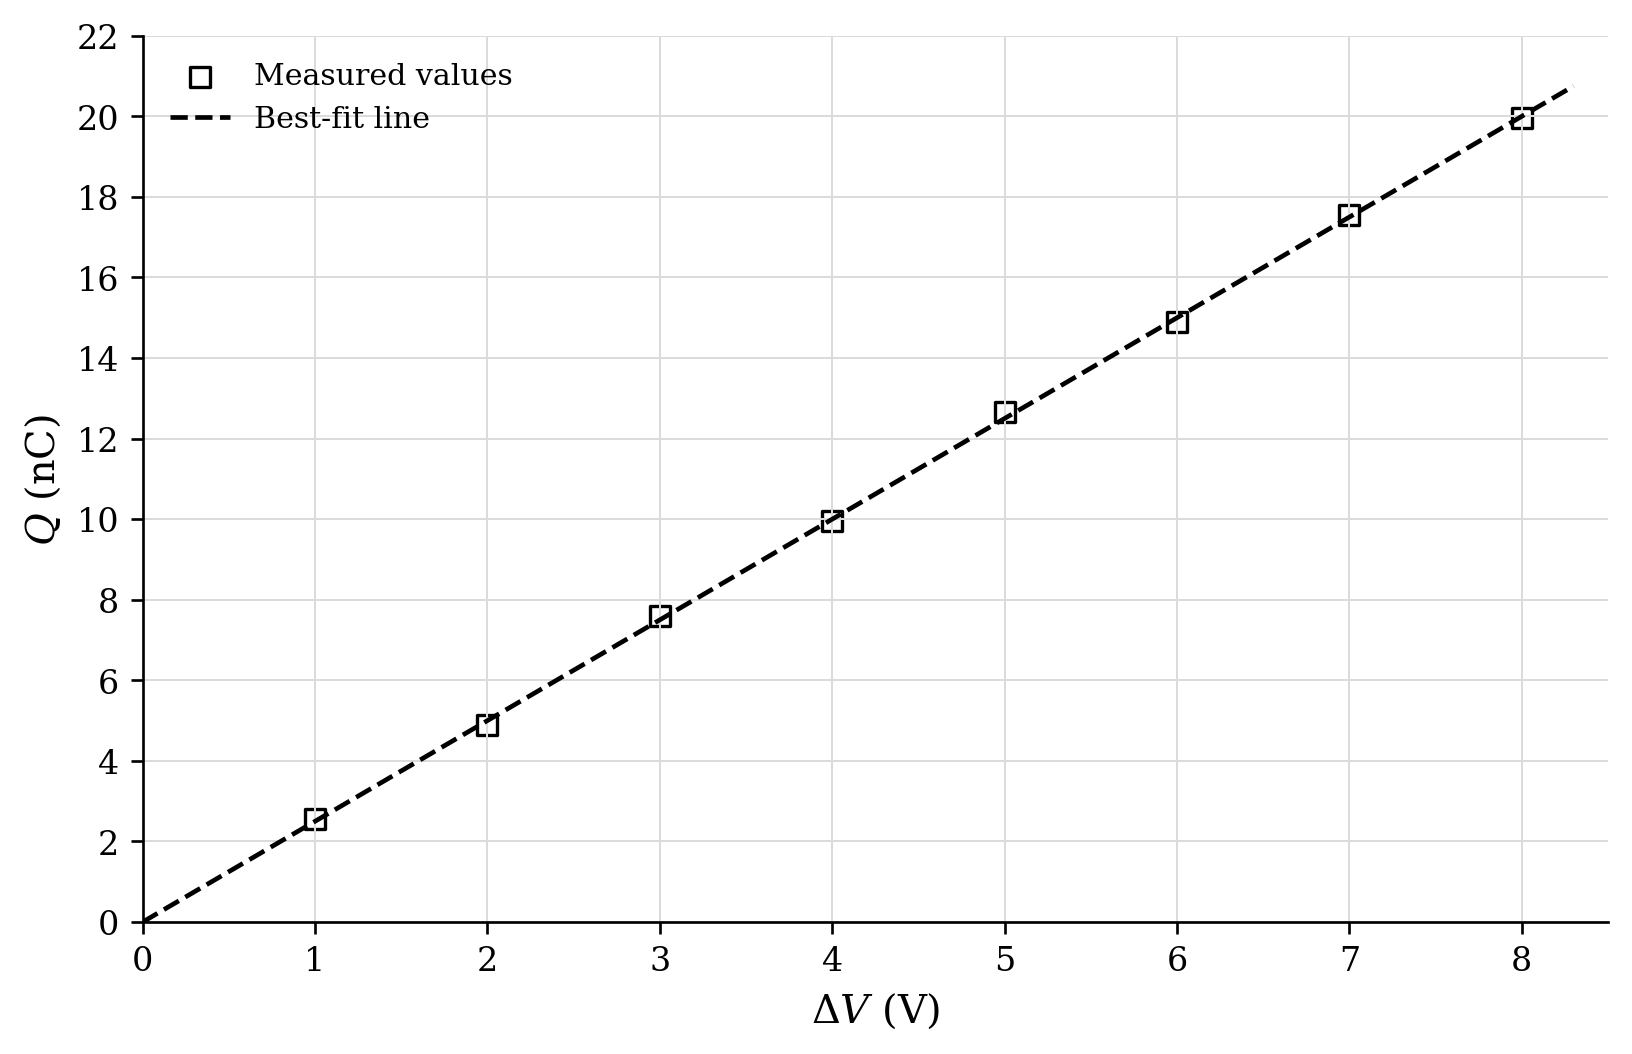
Determine the capacitance of the capacitor represented by the graph.
Describe an experimental procedure to investigate how the capacitance of a parallel-plate capacitor depends on the overlapping plate area. Include the equipment, the independent and dependent variables, important controls, repeated measurements, and the graphical analysis.
A different investigation is performed using two plates with a fixed overlapping area. The plate separation is changed, and the capacitance is measured.
Trial : ; .
Trial : ; .
Trial : ; .
Trial : ; .
Trial : ; .
Trial : ; .
The space between the plates is air. Use .
Calculate for Trial in .
Plot as a function of using all six observations, and draw a best-fit line.
Determine the slope of the best-fit line.
Calculate the overlapping plate area.
Question 8
A positively charged particle is released from rest at a location where the electric potential is . It subsequently moves through an electrostatic field. No non-electric force does work on the particle.
The graph shows the particle’s kinetic energy as a function of the electric potential at its location.
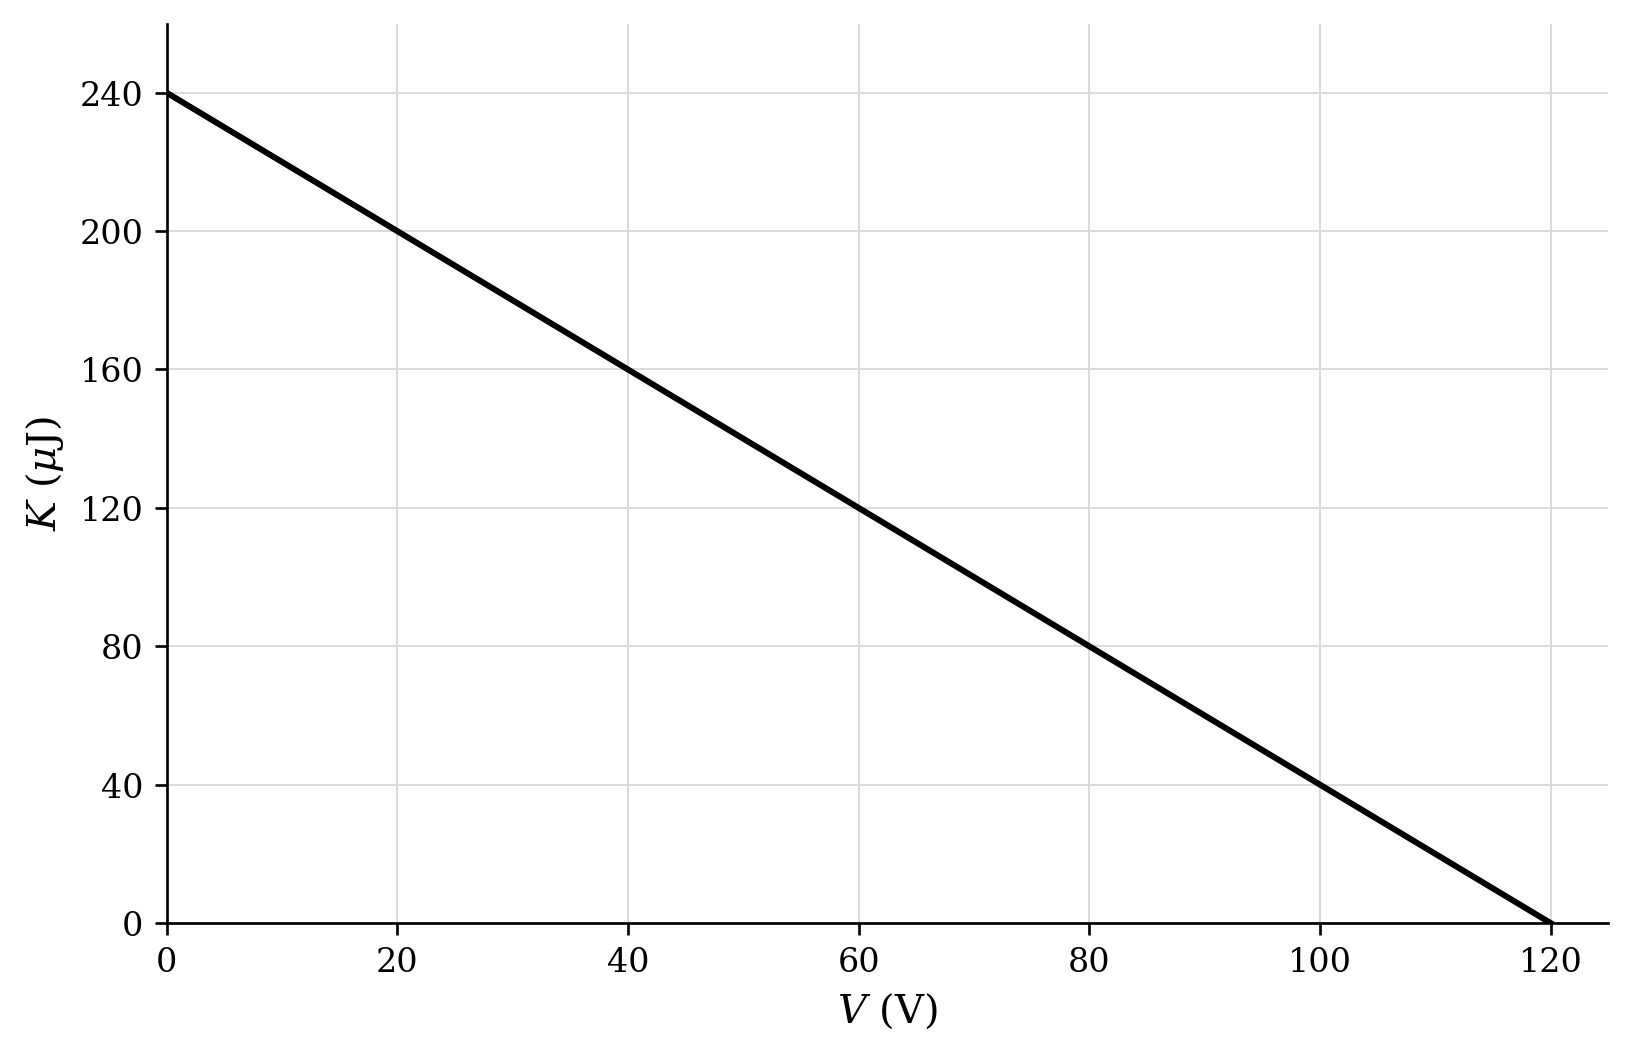
Determine whether the particle moves toward increasing or decreasing electric potential as its kinetic energy increases.
Justify the relationship between the direction of motion and the change in kinetic energy using electric potential energy and conservation of energy.
Let the initial potential be and the particle’s charge be . Derive an expression for the kinetic energy when the particle is at potential .
Determine the particle’s charge, including its sign.
Determine the direction in which a particle of charge would initially accelerate if released from rest at the same starting location, and justify the direction.
Question 9
A parallel-plate capacitor has plates of unknown area . Edge effects are negligible. The magnitude of free charge on each plate is .
Measurements of the electric-field magnitude between the plates are made with two different materials filling the space between them. Medium A is vacuum, with dielectric constant . Medium B has an unknown dielectric constant .
Use .
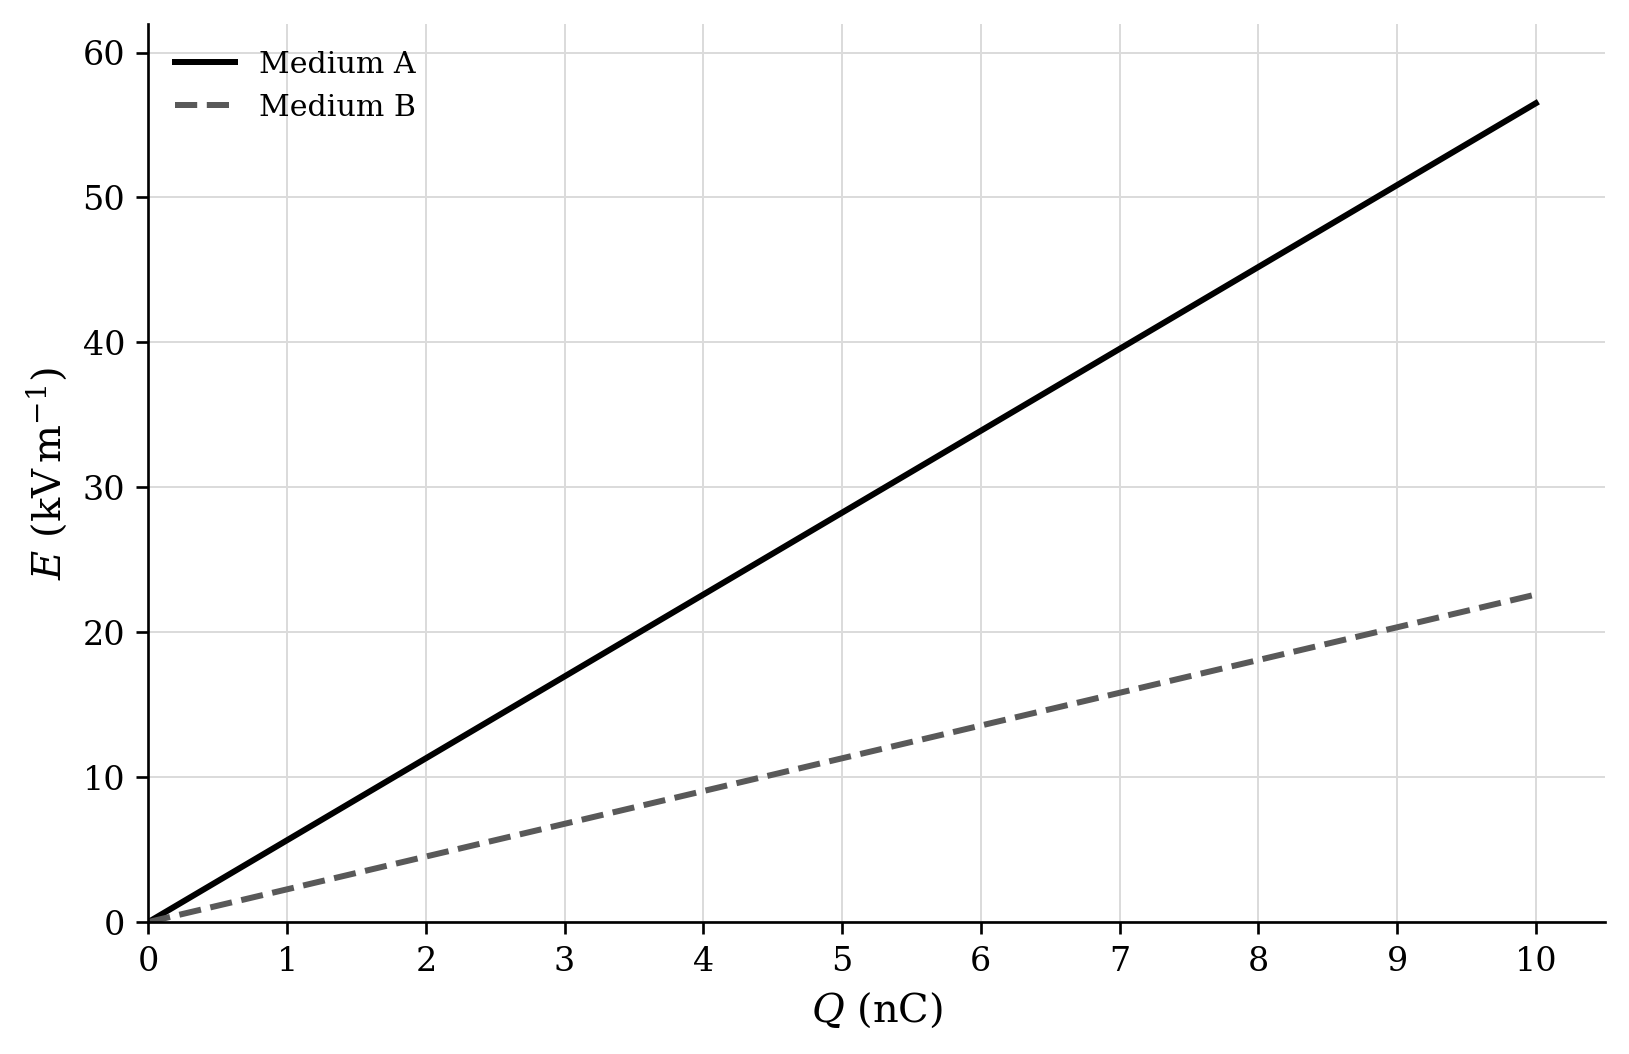
Determine the slope of each plotted line.
Let represent the slope of an -versus- graph. Derive an expression for in terms of , , and .
Calculate the plate area using the line for Medium A.
Calculate the dielectric constant .
A particle of charge and mass is placed between the plates when Medium B is present and .
Draw the plates, the electric-field direction, and the direction of the electrostatic force on the particle.
Calculate the particle’s acceleration.
Justify why the electric field is smaller with Medium B than with Medium A for the same free plate charge.
Question 10
Two large parallel conducting plates are separated by an air gap. The left conductor occupies the region from to , and the right conductor occupies the region from to .
The graph shows electric potential as a function of horizontal position .
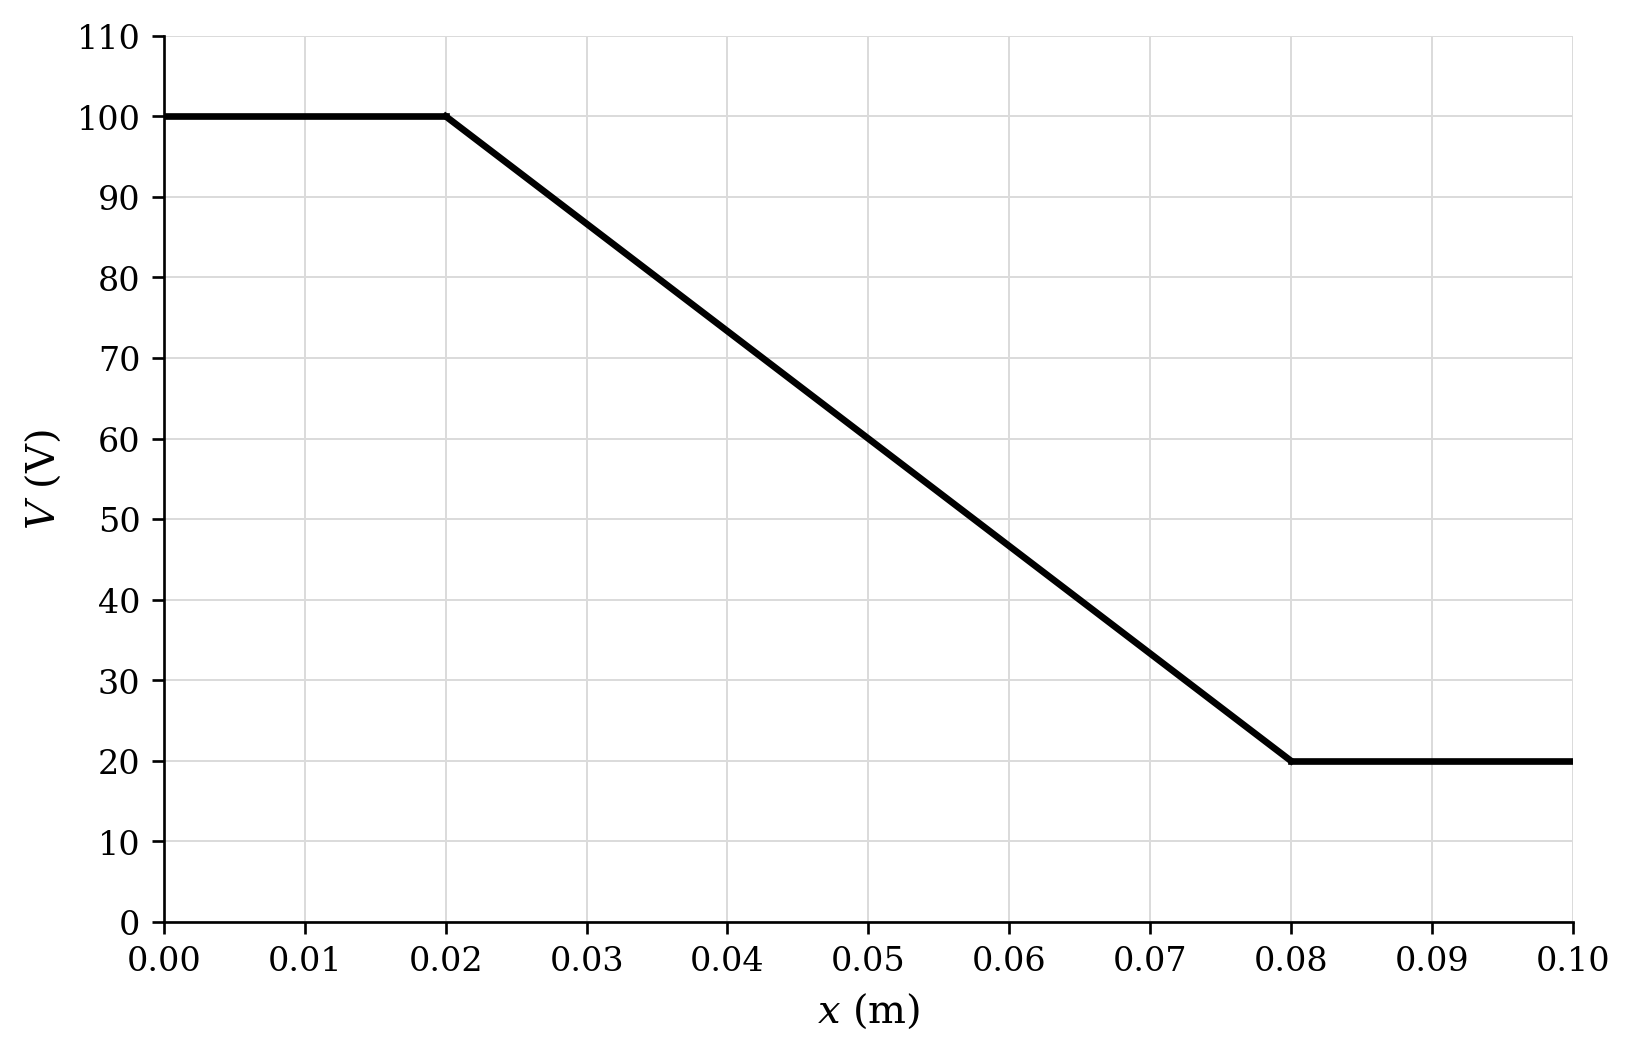
Determine the magnitude and direction of the electric field in the air gap.
Draw a side-view schematic showing the two conducting plates, the signs of their surface charges, at least three equipotential lines in the gap, and electric-field vectors.
A particle with charge and mass is released from rest in the gap.
Let the potential difference magnitude between the plates be and the gap width be . Derive an expression for the magnitude of the particle’s acceleration.
Calculate the particle’s acceleration.
Sketch the particle’s horizontal velocity as a function of time from release until it reaches the right plate.
Compare the initial acceleration of this particle with that of a particle having charge and the same mass, released from rest at the same location.
Justify how the shape of the potential graph is consistent with the electric field inside the conductors and in the gap.